OK, first off a true confession. I hate it when some wise acre analyst acts like they are so smart and that everyone else is an idiot. Its offensive and off-putting – not to mention arrogant. And still in this case, all I can say is “Hi, my name is Jay.”
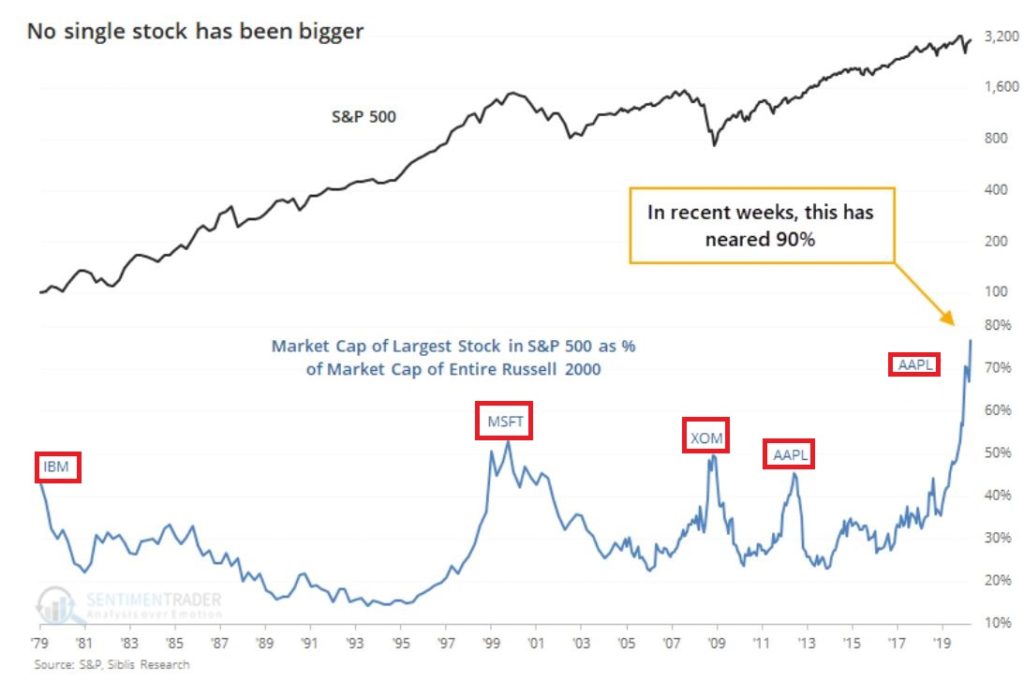
A lot of attention has been paid lately to the fact that AAPL is essentially swallowing up the whole world in terms of market capitalization. As you can see in Figure 1, no single S&P 500 Index stock has ever had a higher market cap relative to the market cap of the entire Russell 2000 small-cap index.
Figure 1 – Largest S&P 500 Index stock as a % of entire Russell 200 Index (Courtesy Sentimentrader.com)
So of course, the easiest thing in the world to do is to be an offensive, off-putting and arrogant wise acre and say “Well, this can’t last.” There, I said it. With the caveat that I have no idea how far AAPL can run “before the deluge”, as a student of (more) market history (than I care to admit) I cannot ignore this gnawing feeling that this eventually “ends badly.” Of course, I have been wrong plenty of times before and maybe things (Offensive, Off-Putting and Arrogant Trigger Warning!) “really will be different this time around.” To get a sense of why I bring this all up, please keep reading.
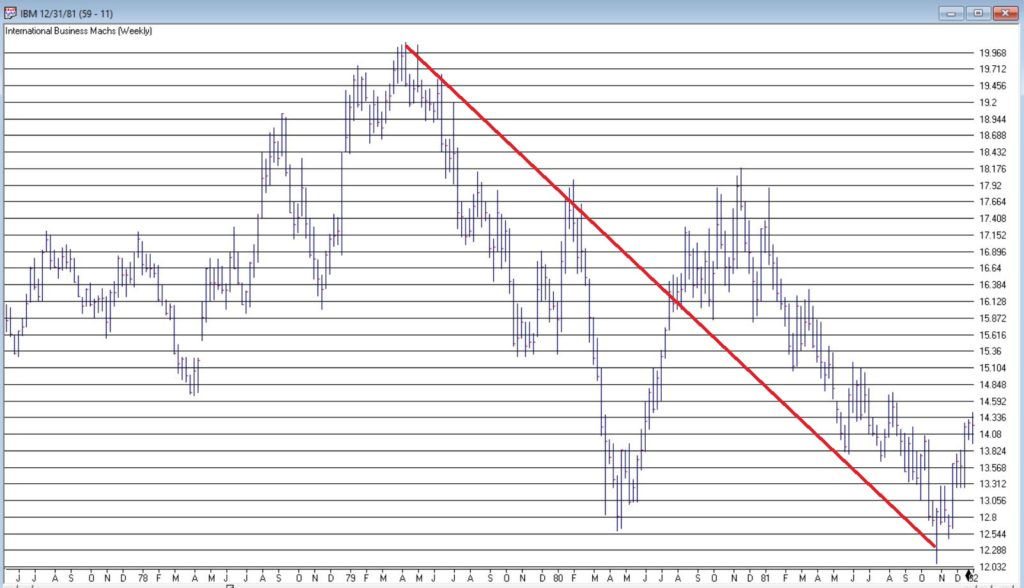
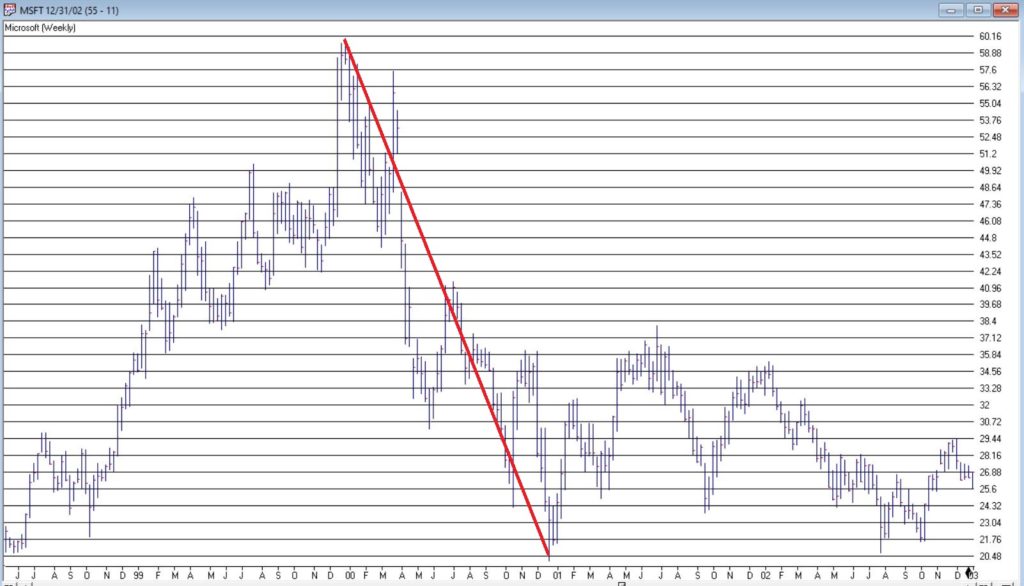
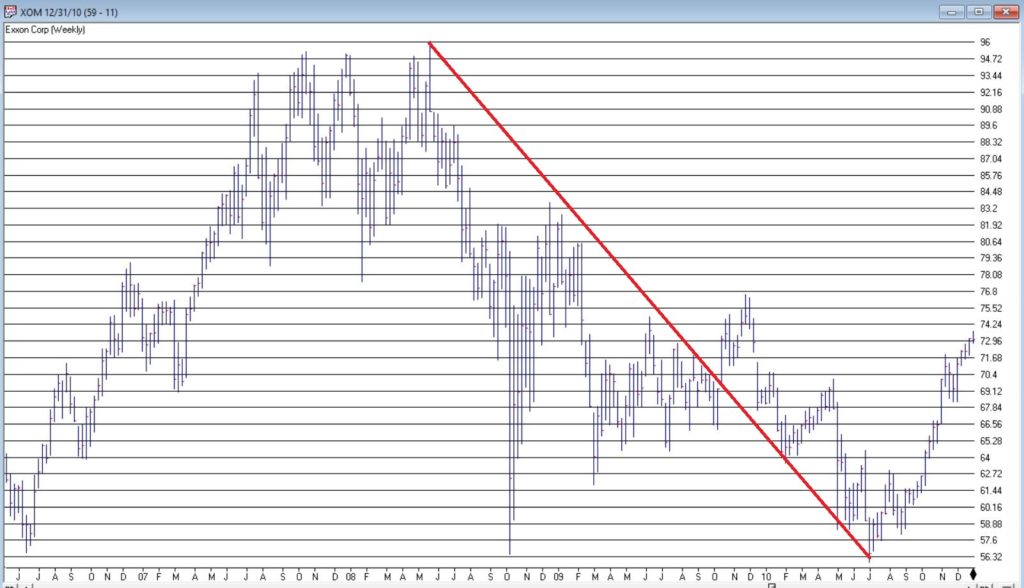
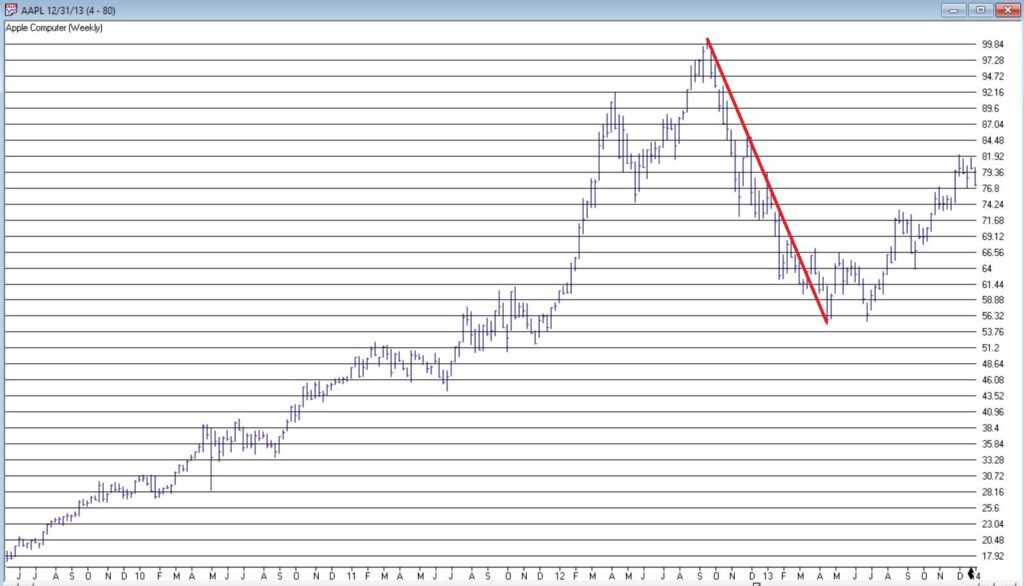
In Figure 1 we also see some previous instances of a stock becoming “really large” in terms of market cap. Let’s take a closer look at these instances.
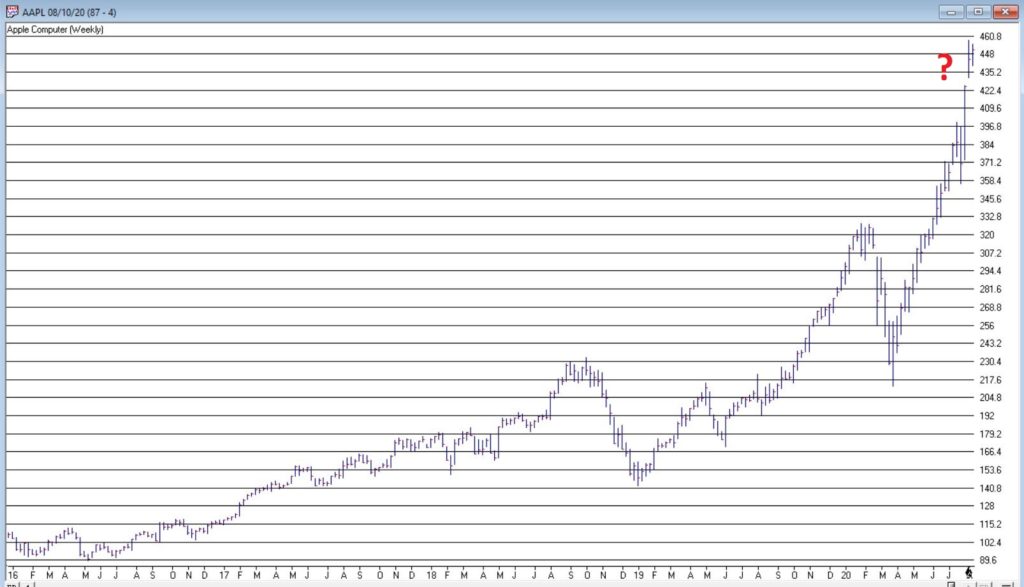
Could AAPL continue to run to much higher levels? Absolutely
Do I still have that offensive, off-putting and slightly arrogant gut feeling that somewhere along the way AAPL takes a huge whack?
Sorry. It’s just my nature.
Jay Kaeppel
Disclaimer: The information, opinions and ideas expressed herein are for informational and educational purposes only and are based on research conducted and presented solely by the author. The information presented represents the views of the author only and does not constitute a complete description of any investment service. In addition, nothing presented herein should be construed as investment advice, as an advertisement or offering of investment advisory services, or as an offer to sell or a solicitation to buy any security. The data presented herein were obtained from various third-party sources. While the data is believed to be reliable, no representation is made as to, and no responsibility, warranty or liability is accepted for the accuracy or completeness of such information. International investments are subject to additional risks such as currency fluctuations, political instability and the potential for illiquid markets. Past performance is no guarantee of future results. There is risk of loss in all trading. Back tested performance does not represent actual performance and should not be interpreted as an indication of such performance. Also, back tested performance results have certain inherent limitations and differs from actual performance because it is achieved with the benefit of hindsight.
In this article, dated 7/10/2020, I noted that my “Stuff” Index was coming on strong and that its performance may be a “shot across the bow” that some changes may be coming to the financial markets. Since then, the trend has accelerated.
STUFF vs. FANG vs. QQQ
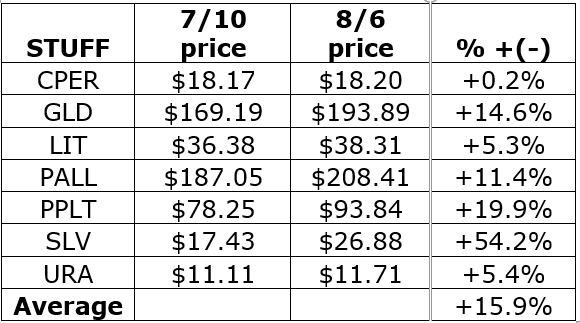
Figure 1 displays the performance of STUFF components since 7/10
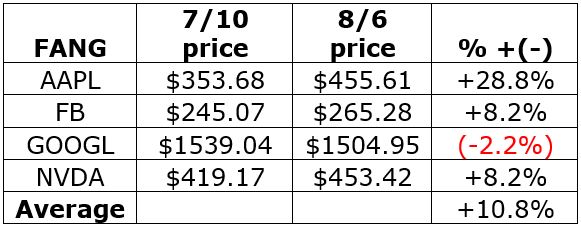
Figure 2 displays the performance of FANG components since 7/10
Figure 1 – Price performance of Jay’s STUFF Index components since 7/10
Figure 2 – Price performance of FANG stocks since 7/10
For the record, the “high-flying” Nasdaq 100 Index (using ticker QQQ as a proxy investment) is up +4.0% during the same time.
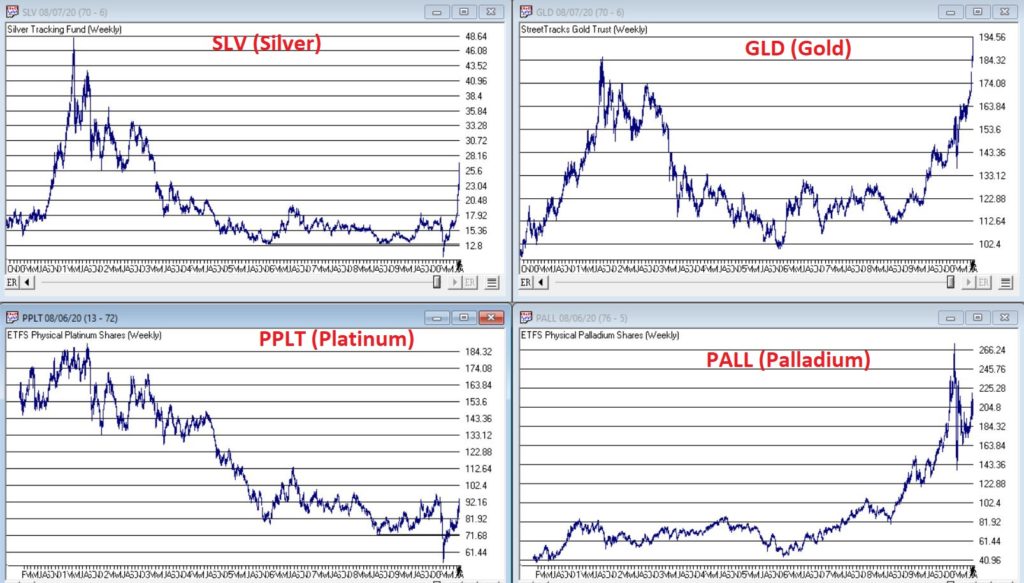
Is this a trend – or a blip? Unfortunately, I can’t answer that question. But it certainly appears that there is something afoot in “Stuff”, particularly the metals. Figure 3 displays the weekly charts for ETFs tracking Silver, Gold, Palladium and Platinum (clockwise from upper left).
When it comes bull markets in metals, the typical pattern historically goes something like this:
*Gold leads the way (check)
*Eventually silver comes on strong and often ends up outperforming gold (check)
*The other metals rise significantly “under the radar” as everyone focus on – literally in this case, ironically – the “shiny objects” (gold and silver)
Again, while I had inklings that a bull market in metals was forming (and have held positions in them for several years, and still hold them), I certainly did not “predict” the recent explosion in gold and silver prices.
Two things to note:
*Gold and silver are obviously very “overbought”, so buying a large position here entails significant risk
*Still it should be noted that both SLV and PPLT would have to double in price from their current levels just to get back to their previous all-time highs of 2011
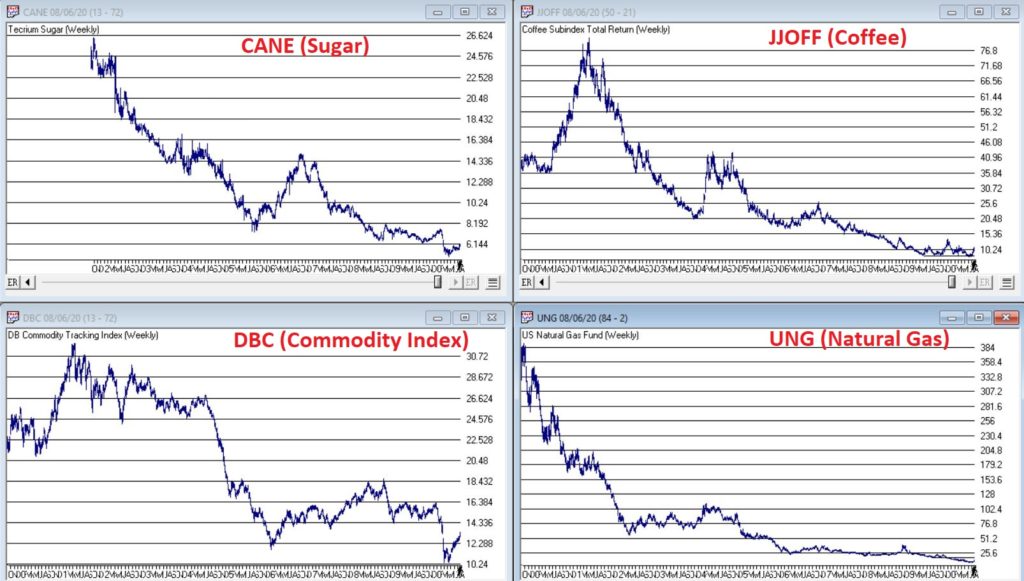
So, don’t be surprised if “Stuff” enjoys a continued resurgence. Note in Figure 4 that a number of commodity related ETFs are way, way beaten down and could have a lot of upside potential if a resurgence actually does unfold.
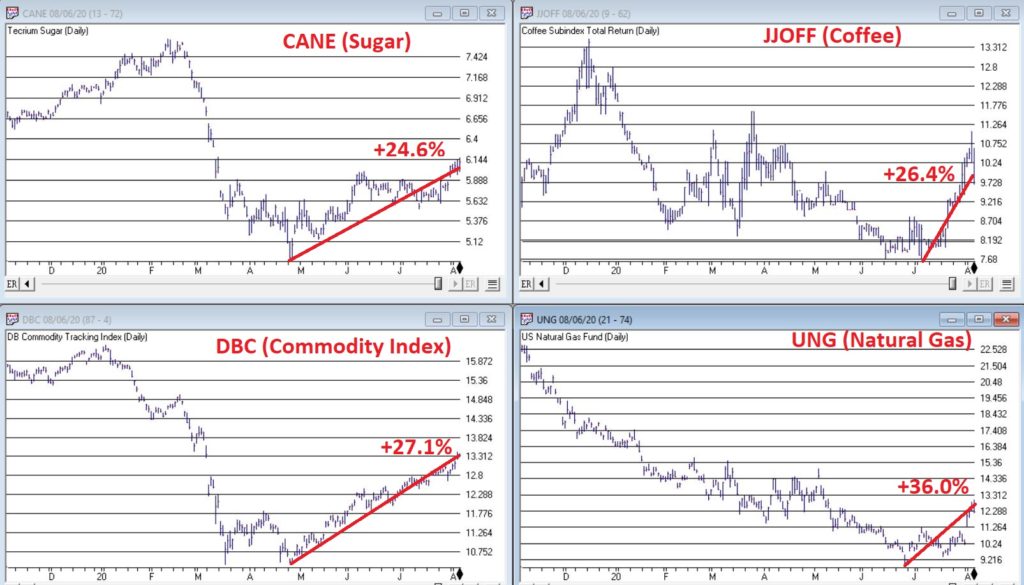
What is interesting – and almost not visible to the naked eye – is the action in the lower right hand corner of these four charts. To highlight what is “hiding in plain sight”, Figure 5 “zooms in” on the recent action of same four tickers as Figure 4, but in a daily price format rather than a monthly price format.
Despite the ugly pictures painted in Figure 4, it is interesting to note in Figure 5 that all four of these commodity related ETFs have rallied sharply of late. There is of course, no guarantee this will continue. But if the rally in “Stuff” – currently led by metals – spreads to the commodity sector as a whole, another glance in Figures 3 and 4 reveals a lot of potential upside opportunity.
Time will tell. In the meantime, keep an eye on the “shiny objects” (gold and silver) for clues as to whether or not the rally in “Stuff” has staying power.
See also Jay Kaeppel Interviewin July 2020 issue of Technical Analysis of Stocks and Commodities magazine
Disclaimer: The information, opinions and ideas expressed herein are for informational and educational purposes only and are based on research conducted and presented solely by the author. The information presented represents the views of the author only and does not constitute a complete description of any investment service. In addition, nothing presented herein should be construed as investment advice, as an advertisement or offering of investment advisory services, or as an offer to sell or a solicitation to buy any security. The data presented herein were obtained from various third-party sources. While the data is believed to be reliable, no representation is made as to, and no responsibility, warranty or liability is accepted for the accuracy or completeness of such information. International investments are subject to additional risks such as currency fluctuations, political instability and the potential for illiquid markets. Past performance is no guarantee of future results. There is risk of loss in all trading. Back tested performance does not represent actual performance and should not be interpreted as an indication of such performance. Also, back tested performance results have certain inherent limitations and differs from actual performance because it is achieved with the benefit of hindsight.
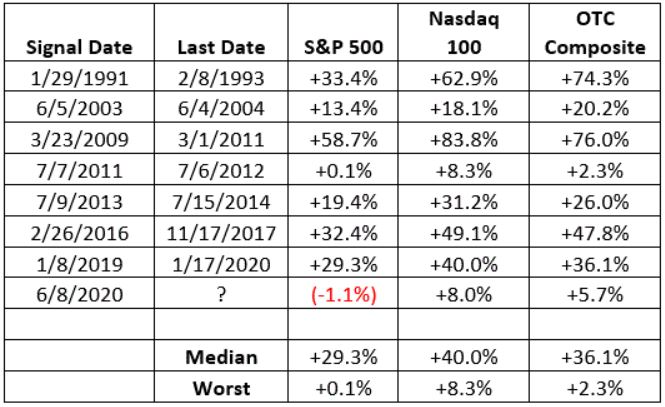
In this article I wrote about a signal called “Bull Market Thrust”. The upshot is that since 1991 it has identified 8 “bullish periods”. The start and end dates of those periods – and the price performance of several indexes during each period – appear in Figure 1.
Figure 1 – “Bull Market Thrust” bullish periods
One key thing to note is that – focusing solely on the Nasdaq 100 Index – 100% of the “bullish periods” witnessed a gain, i.e., “perfection.” The average gain was +40%.
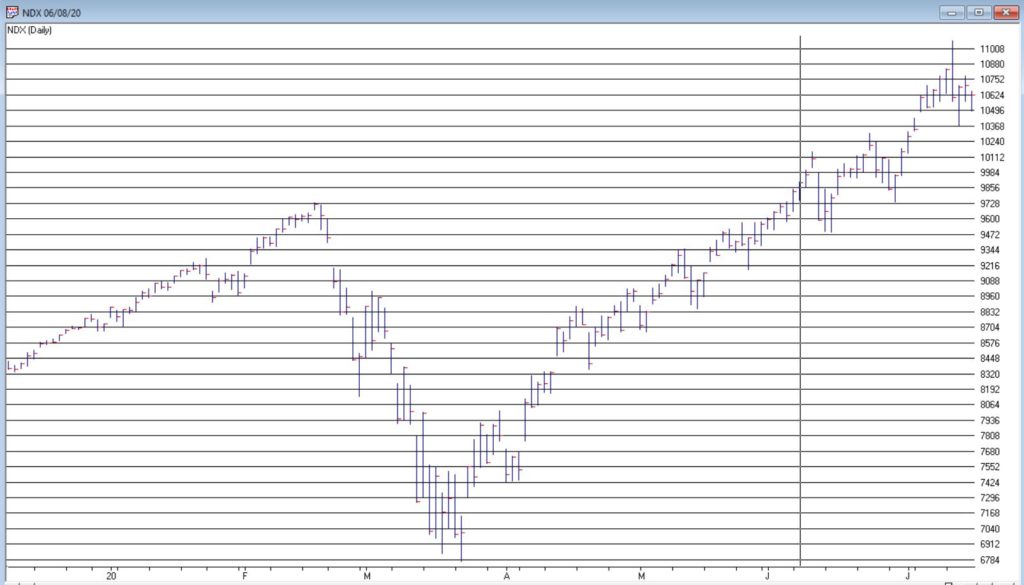
So that looks pretty good and pretty darned encouraging going forward since there was a new buy signal on June 8th of this year. And indeed, if history is a guide the outlook for the Nasdaq (and the stock market as a whole) is favorable in the next year. But there is one thing to keep in mind….
Jay’s Trading Maxim #33: When you have actual money on the line, the chasm between theory and reality can be a mile wide.
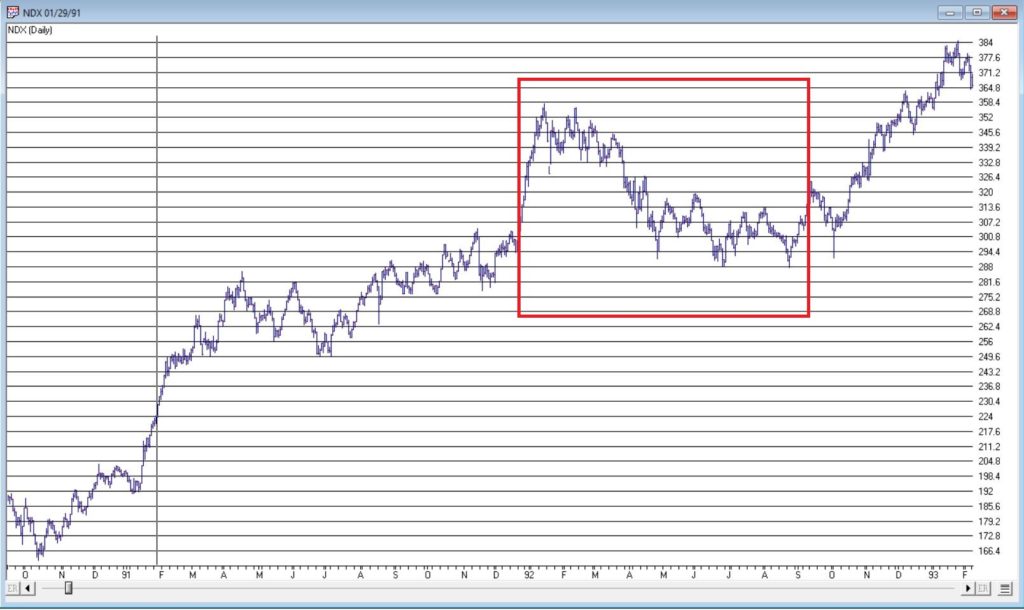
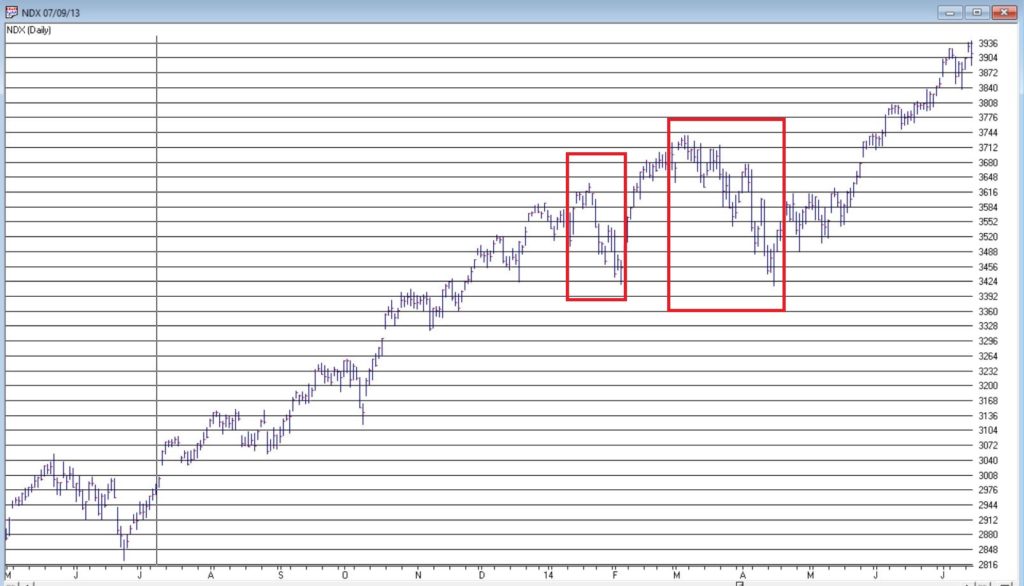
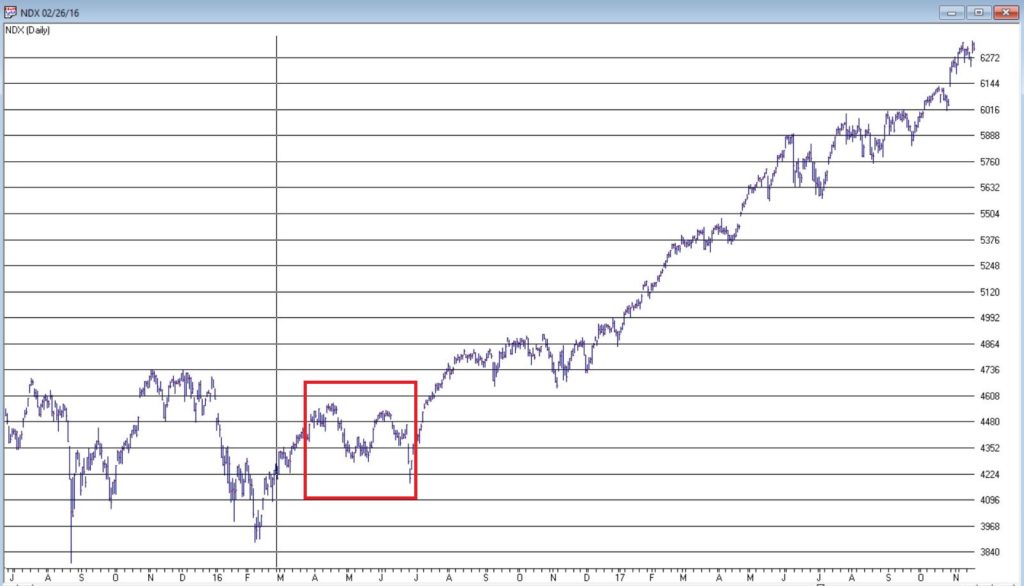
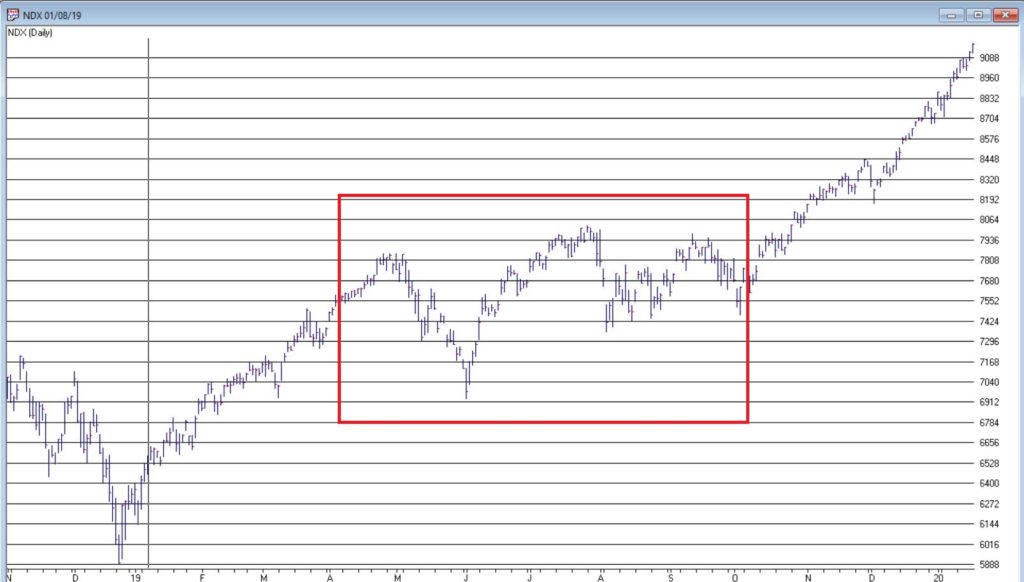
The bottom line is that even during “bullish periods” the market fluctuates. And if one is focused on “news” there is plenty of opportunity to feel angst no matter how strong the market “should be.” So, in an effort to “mange expectations”, the charts below display the price action of the Nasdaq 100 during each “bullish period” displayed in Figure 1.
Nasdaq 100 during “Bullish Periods” based on Bull Market Thrust signals
*Each chart displays one of the “Bullish Periods” from Figure 1.
*Each chart contains one or more red boxes highlighting a period of “market trouble”
THE POINT: the key thing to ponder is how easily it would be to allow yourself to get “shaken out” if you were focused on what the “news of the day” is telling you, rather than what the market itself is telling you.
Figure 2 – NDX: 1/29/91 – 2/28/93
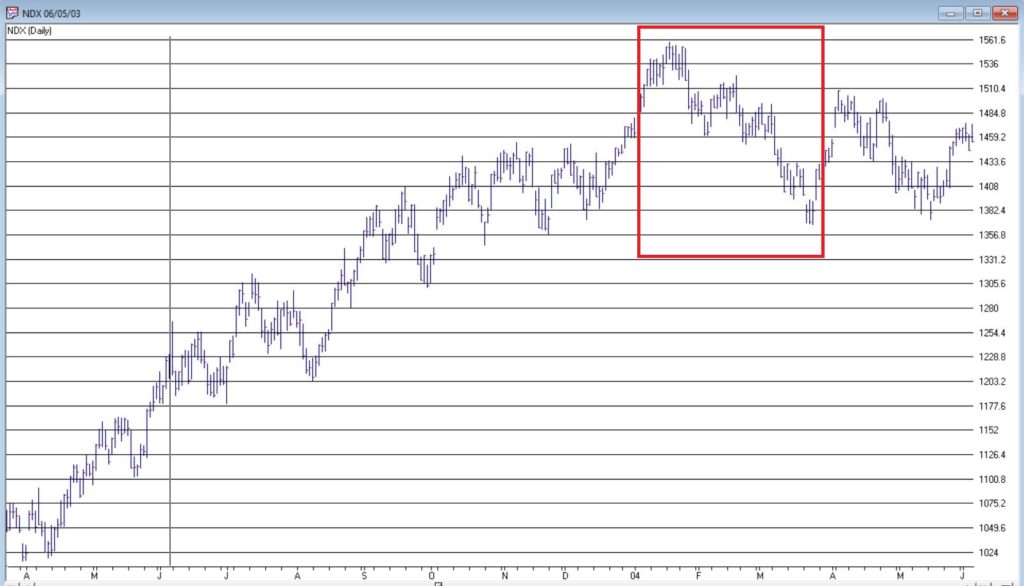
Figure 3 – NDX: 6/5/2003-6/4/2004
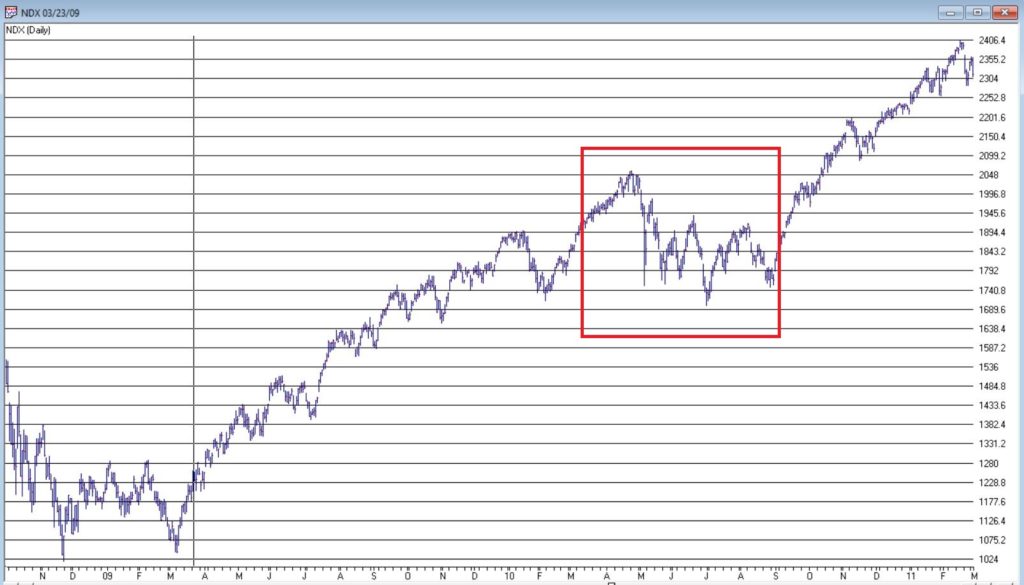
Figure 4 – NDX: 3/23/2009-3/1/2011
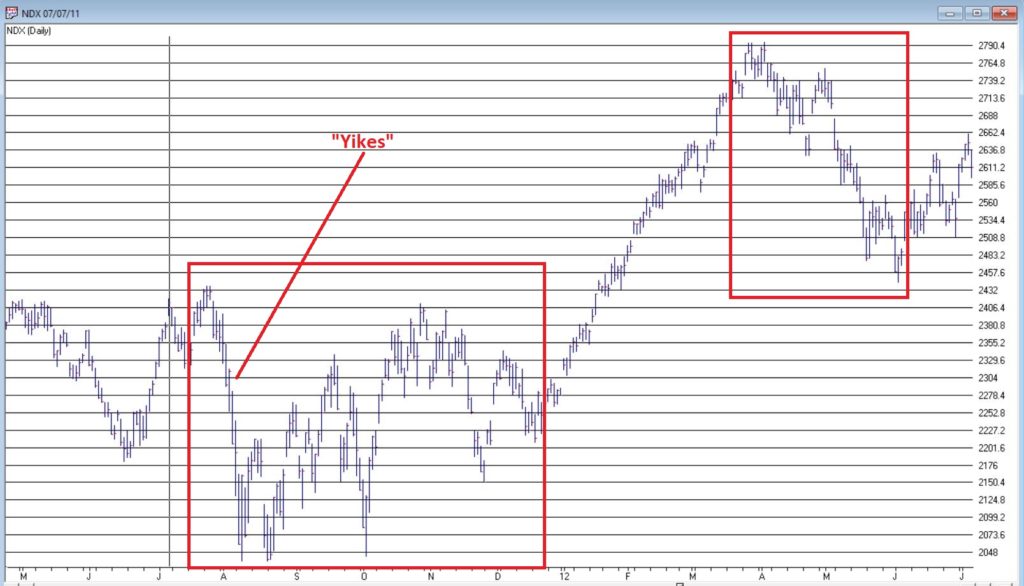
Figure 5 – NDX: 7/7/2011-7/6/2012
Figure 6 – NDX: 7/9/13-7/15/2014
Figure 7 – NDX: 2/26/2016-11/17/2017
Figure 8 – NDX: 1/8/2019-1/17/2020
Figure 9 – 6/8/2020-?
The bottom line is that:
*Sometimes the market “took off” after the signal
*Sometime the market sold off shortly after the signal (see 2011 signal)
*In every case there was a drawdown of some significant somewhere along the way
The purpose of paying attention to things like “Bull Market Thrust” buy signals is not to “pick bottoms with uncanny accuracy.”
In the real word, the purpose is to help strengthen our resolve in riding the exceptional opportunities.
See also Jay Kaeppel Interview in July 2020 issue of Technical Analysis of Stocks and Commodities magazine
Disclaimer: The information, opinions and ideas expressed herein are for informational and educational purposes only and are based on research conducted and presented solely by the author. The information presented represents the views of the author only and does not constitute a complete description of any investment service. In addition, nothing presented herein should be construed as investment advice, as an advertisement or offering of investment advisory services, or as an offer to sell or a solicitation to buy any security. The data presented herein were obtained from various third-party sources. While the data is believed to be reliable, no representation is made as to, and no responsibility, warranty or liability is accepted for the accuracy or completeness of such information. International investments are subject to additional risks such as currency fluctuations, political instability and the potential for illiquid markets. Past performance is no guarantee of future results. There is risk of loss in all trading. Back tested performance does not represent actual performance and should not be interpreted as an indication of such performance. Also, back tested performance results have certain inherent limitations and differs from actual performance because it is achieved with the benefit of hindsight.
Inflation was a big deal – back in the late 70’s and early 80’s. Since then it has been the subject of a whole lot of “the boy crying wolf” scenarios. Take a look at Figure 1. The red line displays the 12-month rate-of-change in the Consumer Price Index (i.e., the annual rate of inflation) since 1913.
Figure 1 – The Consumer Price Index (1913-2020)
Things to note, focusing on 1930 forward to the present:
*In the 1930’s we had deflation (actually much worse than inflation as the economy essentially spirals lower and slower) with the CPI reaching almost -10%
*There were peaks in the 15% range in the late 1940’s and late 70’s/early 80’s
*As you can see in the black box to the right hand side, inflation has been less than 5% annually for most of the last 35 years
As a result, most investors have been conditioned to not fret too much about inflation. And any time spent actually worrying about inflation in the past several decades has been a waste of good anxiety.
But nothing lasts forever. Especially in the financial markets, where things tend to move in a cyclical nature over long periods of time. To illustrate this point with a random, yet related example, consider Figure 2 which displays the yield on 30-year treasury bonds since 1942.
Figure 2 – 30-year treasury bond yield (1942-2020) (Courtesy: www.StockCharts.com)
Since the early 1980’s, investors have been nicely rewarded for holding bonds – especially long-term bonds. But from the mid 1950’s into 1980 the experience was much different (rising yields equate to lower bond prices). Presumably someday rates will rise again and an entire generation of bond investors will have no idea what is happening to their investments (see here, here, here and here). But for now, we are focusing on inflation.
How to Know When to Worry About Inflation
I’ll give you three things to follow.
#1. Gold
In a recent paper co-authored by legendary trader Paul Tudor Jones (see here) the authors laid out the case for higher inflation in the years ahead and suggested gold bullion could reach $2,400 an ounce. Is this a possibility? Absolutely.
Figure 3 displays from 2005 through 2012:
*ticker GLD (an ETF that tracks the price of gold bullion)
*my own index called ANTIGLD3 (components highlighted on right) with a Front Weighted Moving Average and a 55-week exponential moving average)
The ANTIGLD3 Index is a contrarian trend-following tool, i.e., when this index is in a downtrend it is bullish for gold and vice versa.
Figure 3 – Ticker GLD versus Jay’s ANTIGLD3 Index (2005-2012) (Courtesy AIQ TradingExpert)
Figure 4 displays the same tickers from 2012 into 2020
Figure 4 – Ticker GLD versus Jay’s ANTIGLD3 Index (2012-2020) (Courtesy AIQ TradingExpert)
The key thing to note in Figure 4 is that after several years of whipsaws the two trend-following indicators applied to ANTIGLD3 are in a clear downtrend (since this is a contrarian index that means it is purportedly bullish for gold).
So, is it off to the races for gold? I can’t say for sure. But it appears to be trying. Also note that gold can rally significantly in price for reasons other than inflation (see 2005-2011 rally)
I have positions in gold and gold stocks but not huge ones. For whatever reason, so far, I am “not feeling it.” As you will see in a moment, some inflation trend-following “things” that I watch have yet to confirm that inflation is an imminent threat at this exact moment.
But I am holding my positions just in case gold itself is the actual “leading indicator” in this story.
#2. The Aussie Dollar versus its 24-month moving average
I covered this in detail here so will not get too in-depth here. But you can get the gist of it pretty simply from Figure 5. The top chart is ticker FXA with a 24-month exponential moving average and the bottom chart is ticker GSG which tracks the Goldman Sachs Commodity Index.
Long story short, commodities – or “hard assets”, are typically a good place to be during a period of sharply rising and/or high inflation – perform better when FXA is in an uptrend (i.e., above the 24-month EMA) than when below. As of early July FXA has just moved above its 24-month EMA. For the record, I usually only consider this at month-end. So, check back after 7/31.
If FXA establishes an uptrend, the likelihood of higher prices for commodities – including gold – rises. Thus, an uptrend for FXA would be another potential warning sign of impending inflation.
#3. TIPs versus Long-Term Treasuries
TIPs bonds are Treasury Inflation Protected securities, i.e., the principal can rise as inflation (based on the Consumer Price Index) rises (see here). In other words, a TIP bond can gain value as inflation rises. Long-term treasuries on the other hand are the securities most likely to get hurt by a rise in inflation (as the rate of return is fixed once you buy the bond and a rise in inflation can reduce the future value and/or purchasing power of that fixed return).
So, in a low inflationary period we typically see TIPs fall relative to long-term treasuries and during rising inflation we would expect to see TIPS rise relative to long-term bonds.
Figure 6 displays the chart of ticker TIP relative to ticker TLT on a weekly basis (with a 200-wekk moving average) from www.StockCharts.com.
Figure 6 – Ticker TIP relative to ticker TLT (weekly) still trending lower (Courtesy: www.StockCharts.com)
The bottom line: While gold itself is attempting to breakout to the upside and the Aussie Dollar is trying to establish an uptrend, the TIP:TLT relationship is not presently indicating any meaningful inflationary concerns.
Summary
Inflation has been low for about 35 years. But as they say, “don’t go to sleep on it.”
If you want to be objectively prepared, keep an eye on:
*Gold bullion (in an uptrend, confirmed by a downtrend in my “anti-gold index”)
*The Aussie Dollar (No trend at the moment, but trying to establish an uptrend)
*Ticker TIP versus ticker TLT (Nowhere close to an uptrend right now)
So one up, one down and one sideways. But pay close attention going forward.
If and when all three establish uptrends, the game we’ve all been playing for several decades will likely change dramatically.
See also Jay Kaeppel Interview in July 2020 issue of Technical Analysis of Stocks and Commodities magazine
Disclaimer: The information, opinions and ideas expressed herein are for informational and educational purposes only and are based on research conducted and presented solely by the author. The information presented represents the views of the author only and does not constitute a complete description of any investment service. In addition, nothing presented herein should be construed as investment advice, as an advertisement or offering of investment advisory services, or as an offer to sell or a solicitation to buy any security. The data presented herein were obtained from various third-party sources. While the data is believed to be reliable, no representation is made as to, and no responsibility, warranty or liability is accepted for the accuracy or completeness of such information. International investments are subject to additional risks such as currency fluctuations, political instability and the potential for illiquid markets. Past performance is no guarantee of future results. There is risk of loss in all trading. Back tested performance does not represent actual performance and should not be interpreted as an indication of such performance. Also, back tested performance results have certain inherent limitations and differs from actual performance because it is achieved with the benefit of hindsight.
Don’t you hate it when some analyst analyzes historical data and then purports to find some “order” in the historical chaos? Hi, my name is Jay. And…it’s just kind of what I do. Sorry, it’s just my nature. Take for instance the ridiculous case of AMD.
Advanced Micro Devices – Ticker AMD
According to “Adjusted Close” price data from www.finance.yahoo.com ticker AMD advanced from $3.15 a share in March of 1980 to $56.39 by May 20, 2020. Given that the stock has risen +1,693% on a buy-and-hold basis, it is not exactly a revelation that – particularly with the huge benefit of perfect hindsight – there was some money to be made by holding the stock.
But that is only part of the story. For as it turns out, AMD is one of the most consistently “cyclical” stocks you may ever find. Figure 1 displays the average annual price trend for AMD from 3/17/1980 through 12/31/1999. In other words, period 1 along the bottom of the chart is January Trading Day #1, and so on, through the last trading day of December.
Figure 1 – Annual Seasonal Price Trend for AMD (1980-1999)
As you can see, the stock tended to rally sharply through the end of May, from mid-July through about late August, and from late October through the end of the year (or more accurately, through the end of the next May).
Declines typically occurred between about June 1st and late July and again during September into late October.
Ah, sweet hindsight.
But what are the odds that any of this was meaningful after 1999? I’m glad you asked. Because that’s where the ridiculous part comes in.
2000-2020
Figure 2 plots the same 1980-1999 annual seasonal price trend for AMD along with the annual seasonal trend for AMD from 2000-2019. Notice any similarities?
Figure 2 – Annual Seasonal Price Trend for AMD; 1980-1999 and 2000-2020
So, let’s make the ridiculous (there’s that word again) assumption that some (lucky) investor had started trading in and out of AMD on an annual basis the following seasonal calendar
Figure 3 – Annual Seasonal Bullish and Bearish Periods
Some how did the “walk forward” period of 2000 into late May-2020 compare to the “hindsight” period of 1980-1999? Well there is good news and bad news.
The bad news is that results for each period was not quite as good during 2000-2020 as they were during 1980-1999. The good news is that the 2000-2020 results were still pretty darn compelling.
Figure 4 – AMD performance during Bullish and Bearish Periods
The bottom line: The “bullish” periods have to continued to be quite bullish and the “bearish” periods continue to be quite bearish.
For the record, between March 1980 and May 2020:
*$1,000 in AMD on a buy-and-hold basis grew to $17,925
*$1,000 in AMD ONLY during the two “bullish” period discussed grew to $587,558,351
Let’s face it, these are – here I go again – ridiculous numbers. And it should be pointed out that an investor holding AMD only during the “Bullish” periods would have suffered 4 separate drawdowns in excess of -50%, including a -79%(!) drawdown in 2008-2009. See Figure 5. So, don’t anybody get “stars in their eyes.”
Figure 5 – Drawdowns during Bullish Periods
At the same time, it is still better than the drawdown racked up during the “bearish” periods, which checks in at a cool -99.9867%. See Figure 6.
Figure 6 – Drawdowns during Bearish Periods
Where We Are
AMD has been in a “bullish” period since the 19th trading day of October 2019, and this period will last until the close on 5/29/2020. Through 5/20/2020 AMD is up +73% during the current bullish period (i.e., pandemic, schmandemic). See Figure 7.
The next “bearish” period will last from the close on 5/29/2020 through the close on 7/23/2020.
Summary
So, in hindsight, the annual seasonal pattern for AMD tracked very closely with the annual seasonal pattern for the previous 20 years. But what about the next 20 years? Ah, there’s the rub. Despite the fact that the annual seasonal trend for the past 20 years very closely mirrored the annual seasonal trend for the prior 20 years, it is not possible to state with any certainty what the next 20 years hold.
Still, if I decide to trade AMD I will probably consult my calendar first.
Disclaimer: The information, opinions and ideas expressed herein are for informational and educational purposes only and are based on research conducted and presented solely by the author. The information presented represents the views of the author only and does not constitute a complete description of any investment service. In addition, nothing presented herein should be construed as investment advice, as an advertisement or offering of investment advisory services, or as an offer to sell or a solicitation to buy any security. The data presented herein were obtained from various third-party sources. While the data is believed to be reliable, no representation is made as to, and no responsibility, warranty or liability is accepted for the accuracy or completeness of such information. International investments are subject to additional risks such as currency fluctuations, political instability and the potential for illiquid markets. Past performance is no guarantee of future results. There is risk of loss in all trading. Back tested performance does not represent actual performance and should not be interpreted as an indication of such performance. Also, back tested performance results have certain inherent limitations and differs from actual performance because it is achieved with the benefit of hindsight.