After 30 years of teaching systematic trading — in seminar rooms in London, Chicago, Los Angeles, and everywhere in between — I’ve published the book I always wanted to exist.
Not a stock-picking guide. Not a single-indicator book.
A complete, systematic framework for reading the market itself.
TIMING THE MARKET: A Systematic Approach to Trading Stock Market Indices
Here’s the insight that drove every chapter:
The S&P 500 is dominated by eight or nine mega-cap technology stocks. Apple. Microsoft. NVIDIA. Alphabet. Amazon. Meta. When those stocks rise, the index rises — even if 400 of the other 500 stocks in the index are falling.
That’s not a market reading. That’s a distortion.
Breadth analysis cuts through this deception. The NYSE Advance-Decline Line, the McClellan Oscillator, New Highs vs. New Lows — these indicators give you the democratic, unweighted, honest picture of what the market is actually doing beneath the surface.
Historically, when the A-D Line diverges negatively from the headline index — when the index is making new highs but the A-D Line is already rolling over — the market is sending an early warning. One that the cap-weighted index won’t show for weeks or months.
This happened before the dot-com crash. Before 2007-2008. Before 2022.
Steve Hill just wrapped a fast-paced 10-minute deep dive into something most traders have never seen done before: using sector ETF breadth data inside AIQ TradingExpert Pro to spot market rotation before it shows up in price.
Here’s why this is different from anything else out there:
Most breadth analysis stops at the NYSE or NASDAQ level. You see advancing vs. declining stocks, and you get a general sense of market health. That’s useful — but it’s incomplete.
When you break the S&P 500 down into its eleven sectors and track each one’s internal breadth data, something remarkable happens. You can see which sectors are quietly leading… and which are fading, even when the headline index looks fine.
Steve walks you through exactly how to set this up in TradingExpert Pro using special sector ETF tickers — and how to read the combined picture to spot high-probability rotation opportunities.
This is institutional-level analysis, built right into the software. Here are the files to make it happen. Don’t have AIQ? There’s a $1 trial offer below for you to check it out.
The 11 SP500 Sector markets are available in this zip file, unzip these to your wintes32/mdata folder
The 11 State Street ETFs are likely already in your AIQ database but are available in this zip file, unzip these to your /wintes32/tdata folder.
The list file for the 11 SP500 Sector markets is here, save to your wintes32 folder.
Make sure you go to Data Manager and under Utilities perform a Rebuild Master Ticker List. Also when updating your data each day, select Update Breadth Tickers and Compute Markets are selected.
The Zweig Thrust was also used on this video, the EDS file for this is here, save to your /wintes32/EDS Strategies folder. In Charts go to Chart, Settings, Indicator Library, EDS Indicators. Add the location to the Zweig EDS file, and for indicator type select one line with upper/lower support. Upper support set to 61, lower support to 40.
Markets in March 2026 were doing what markets do best — confusing people. Prices were pulling back. Headlines were negative. The majority of traders were uncertain, defensive, or on the sidelines.
But inside TradingExpert Pro, the market timing model was building a case. Not based on opinion. Not based on news. Based on the systematic, rule-by-rule analysis that AIQ has refined over three decades. And by the end of March, that case was overwhelming.
Here’s exactly what the system saw — and what it meant.
March 18 & 19 — The Opening Signal
On March 18, the AIQ market timing model issued an Expert Rating of 96 — Up. The following day, March 19, it fired again: another 96 — Up.
Back-to-back readings above 95 in consecutive sessions are not noise. An Expert Rating above 95 represents a high-conviction bullish technical condition — the system telling you, in its clearest language, that the weight of technical evidence favours higher prices. When that reading repeats on consecutive days, the model is reinforcing its own conclusion.
At this point, the disciplined AIQ trader is already paying close attention.
March 25 — Phase Analysis Confirms the Direction
4 days later, on March 25, Phase Analysis confirmed what the Expert Rating had been signalling.
The market Phase changed to Up.
This is a pivotal moment in any signal sequence. The Expert Rating identifies the condition; Phase Analysis identifies the trend cycle. When a high Expert Rating is followed by a Phase change in the same direction, the two most important components of the AIQ market timing model are in full agreement. The signal is no longer early — it is confirmed.
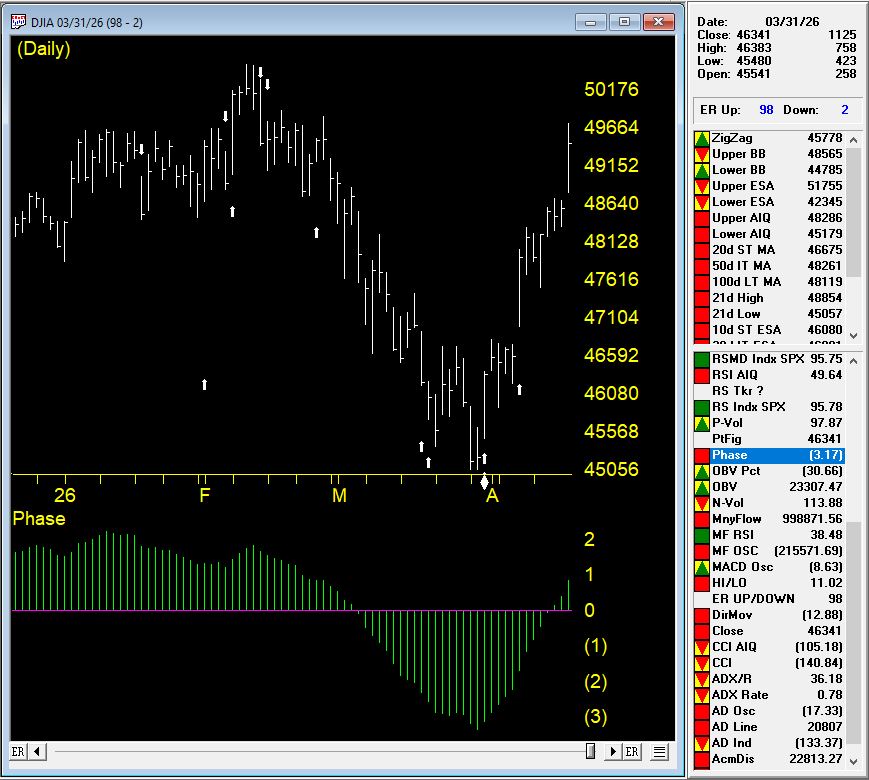
March 31 — The Full Picture
March 31 produced the most powerful single-day reading in the sequence — an Expert Rating of 98 — Up, arriving with Phase already turned upward. The individual timing rules that fired during this sequence tell a story that every AIQ trader should understand, because they illustrate precisely how the system thinks.
Rule 1: 21-Day Low Intraday Price with Positive Volume Accumulation
Intraday low prices declined to a 21-day low — a reading that, on the surface, looks bearish. But volume accumulation percentage was positive. In AIQ’s market timing logic, this non-confirmation is a weak bullish signal. Price is making new lows, but money is not leaving the market. That divergence matters.
Rule 2: 21-Day Low Closing Price with Rising Advance/Decline Breadth
Closing prices also reached a 21-day low. Again, superficially bearish. But market breadth — measured by advances versus declines — was increasing. When prices fall to new lows but more stocks are advancing than declining, the selling is not broad-based. This non-confirmation is a bullish signal indicating a possible upward price movement. The majority of the market is quietly holding up while the index prints a low.
Rule 3: 21-Day Low Closing Price with Rising Advance/Decline Oscillator
A third rule reinforced the same theme: closing prices at a 21-day low, but the advance/decline oscillator increasing. Another non-confirmation. Another bullish signal. Three separate breadth and price divergence rules all pointing the same direction — up.
Rule 4: 21-Day Stochastic Crossing the 20% Line with Rising Price Phase
The 21-day stochastic advanced and crossed the 20% line, while the price phase indicator was also increasing. In a weakly downtrending market, AIQ classifies this combination as a strong bullish signal suggesting an increase in prices. The stochastic crossing 20% from below is a classic oversold recovery signal — but paired with a rising price phase, it carries significantly more weight.
Rule 5: Rising Volume Accumulation with 21-Day Stochastic Above 20%
Volume accumulation percentage was increasing while the 21-day stochastic moved above the 20% line. In a downtrending market, AIQ rates this a strong bullish signal. Volume accumulation captures the relationship between buying and selling pressure over time. When it starts rising in a downtrend while momentum is recovering from oversold levels, the path of least resistance is shifting.
Rule 6: Negative Price Phase with Rising Volume Accumulation
Finally, even with the price phase still registering negative, volume accumulation had started to advance. In AIQ’s rules, this non-confirmation — volume diverging positively from a negative price phase — is a bullish signal regardless of market type. It doesn’t matter what the trend classification is. When volume accumulation turns up against a negative phase, the model says: the market is preparing to move higher.
What the Full Sequence Tells Us
Step back and look at this sequence as a whole.
March 18: Expert Rating 96 — Up. March 19: Expert Rating 96 — Up, confirmed. March 25: Phase changes to Up, validating both prior signals. March 31: Expert Rating 98 — Up, with six individual timing rules all firing bullish simultaneously, spanning price divergence, breadth divergence, volume accumulation, stochastic recovery, and phase analysis.
Every single component of the AIQ market timing model was in agreement. Rules that look at price. Rules that look at breadth. Rules that look at volume. Rules that look at momentum. All saying the same thing at the same time.
This is exactly the kind of multi-confirmation environment that the system is designed to identify — and that individual traders, relying on headlines or gut instinct, almost always miss. When prices are making 21-day lows and geopolitical news is negative, the human instinct is to step back. The AIQ system, by contrast, was reading below the surface and identifying that the internal structure of the market was quietly rebuilding.
The Lesson
Price can lie. Headlines always lie. But when multiple independent technical rules — breadth, volume, momentum, phase — all non-confirm a price low at the same time, the market is telling you something important: the selling is exhausted, and the buyers are already at work beneath the surface.
The March 2026 signal sequence is a textbook demonstration of why systematic, rule-based market timing produces results that emotional, discretionary trading cannot replicate. You don’t need to know whether the Iran conflict resolves or whether the Fed changes course. You need to know what the internals of the market are doing — and let a proven system tell you.
On March 18, the system said up. On March 19, it said it again. On March 25, Phase confirmed it. On March 31, rules piled on with a 98-rated exclamation mark.
The traders who followed the signals were on the right side of the move. That’s what systematic market timing is built for.
In this fast-moving 45-minute I demonstrated how AI can assist in developing real trading strategies for use inside AIQ’s Expert Design Studio.
You’ll watch the process unfold step by step:
• From concept → rules
• From rules → testable strategy
• From manual effort → AI-assisted efficiency
Whether you’re new to system development or already building strategies, you’ll walk away with practical ideas you can apply immediately. If you believe smarter tools lead to better decisions, don’t miss this video.
This zip files contains the 8 strategy EDS file used in the video, together with the text files, Strategy Guide, Quick Reference, and Implementation Checklist generated by the AI and used in the session is available at
Steve Hill, CEO of AIQ Systems, conducted a 45-minute Zoom session demonstrating how to use AI, specifically Claude by Anthropic, to create trading strategies and indicators within the AIQ TradingExpert Pro Expert Design Studio.
Steve showed how Claude can generate custom indicators and strategies from scratch, including a volume-weighted momentum indicator and a consecutive close filter indicator, which were successfully implemented and tested in the system.
He explained the process of creating these indicators, including debugging and testing them, and demonstrated how the AI-generated strategies could be backtested on a database of stocks.
Steve emphasized that while AI tools like Claude can significantly speed up the development process and create new indicators not previously available in the system, traders still need to validate and test the effectiveness of these strategies through backtesting and further refinement.