Master the Indicators. Read Any Chart.
Transform raw chart data into actionable trading insights with the definitive guide to 29 essential technical indicators — every one explained in plain English, with 40+ real chart examples from 2025 markets.
Everything Between You and a Confident Chart Read.
29 Essential Indicators
From Moving Averages to Bollinger Bands, MACD to Stochastics — all explained in plain English.
Real Market Examples
40+ recent chart examples from 2025 showing exactly how each indicator performs in actual market conditions.
Actionable Strategies
When to buy, when to sell, and how to combine indicators for stronger confirmation signals.
Optimal Settings
Generally accepted input values and parameter ranges for each indicator so you can start quickly.
Avoid Common Errors
The interpretation mistakes that cost traders money — and how to avoid them.
Any Platform
Strategies that apply across trading platforms, with examples you can implement immediately.
Learn Proven Strategies — the Combinations Professionals Use.
Stochastic Oscillator — Overbought/Oversold Signals
Buy signal: Stochastic crosses above 20 from below (oversold zone), especially with bullish price action.
Sell signal: Stochastic crosses below 80 from above (overbought zone), particularly when price shows weakness.
MACD — Trend Following & Divergence
Buy signal: MACD crosses above signal line while both are below zero, or bullish divergence (price makes lower low, MACD makes higher low).
Sell signal: MACD crosses below signal line while both are above zero, or bearish divergence (price higher high, MACD lower high).
Volume + Price Action — Confirmation Strategy
Buy signal: volume spike on a breakout above resistance — institutional accumulation confirming the move.
Sell signal: high volume on a breakdown below support, or declining volume during a rally (distribution phase).
Stochastic + MACD — The Power Setup
Buy signal: Stochastic crosses above 20 (oversold) AND MACD crosses above its signal line within 1–3 bars of each other.
Sell signal: Stochastic crosses below 80 (overbought) AND MACD crosses below its signal line within 1–3 bars.
Bollinger Bands — Volatility Breakouts
Buy signal: price touches the lower band, then closes back inside with rising volume — or a "squeeze" (bands tighten) followed by a breakout above the upper band.
Sell signal: price touches the upper band, then closes back inside with volume — or a breakdown below the lower band after a squeeze.
ZigZag — Identifying Swing Points
Buy signal: ZigZag identifies higher swing lows in an uptrend — buy near the new swing low, stop below the previous swing low.
Sell signal: ZigZag shows lower swing highs in a downtrend — sell near the new swing high, stop above the previous swing high.
See the Indicators in Action.
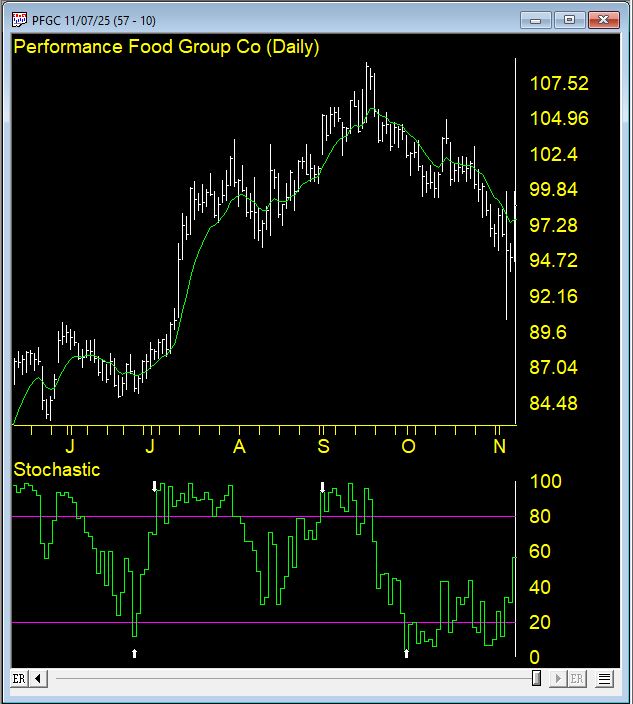


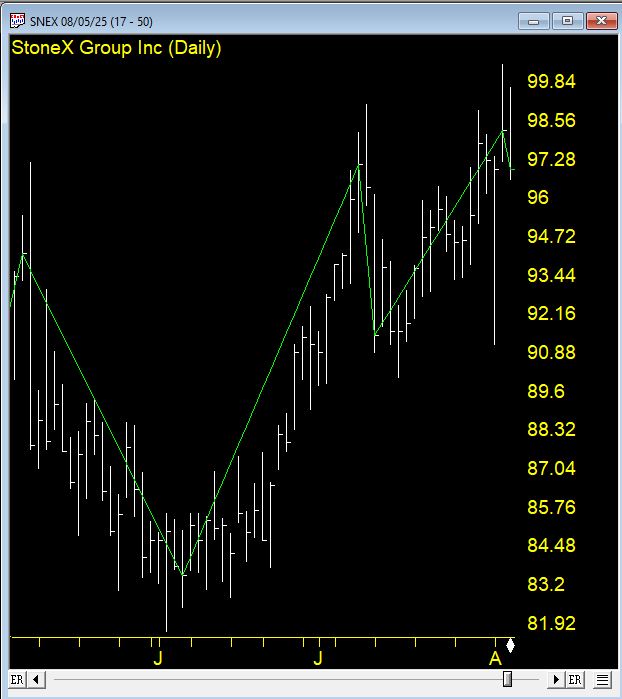
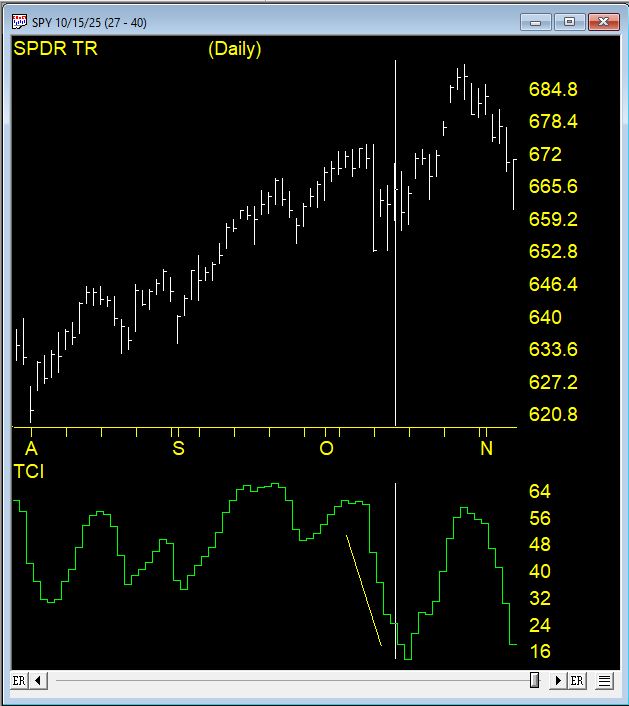
From Raw Chart to Confident Decision.
Every Indicator You Need.
Start Trading Smarter Today.
Join traders who've transformed their approach with ChartSmart.
Want all three AIQ trading books? See The Complete Trader's Library 2026 →