Inflation was a big deal – back in the late 70’s and early 80’s. Since then it has been the subject of a whole lot of “the boy crying wolf” scenarios. Take a look at Figure 1. The red line displays the 12-month rate-of-change in the Consumer Price Index (i.e., the annual rate of inflation) since 1913.
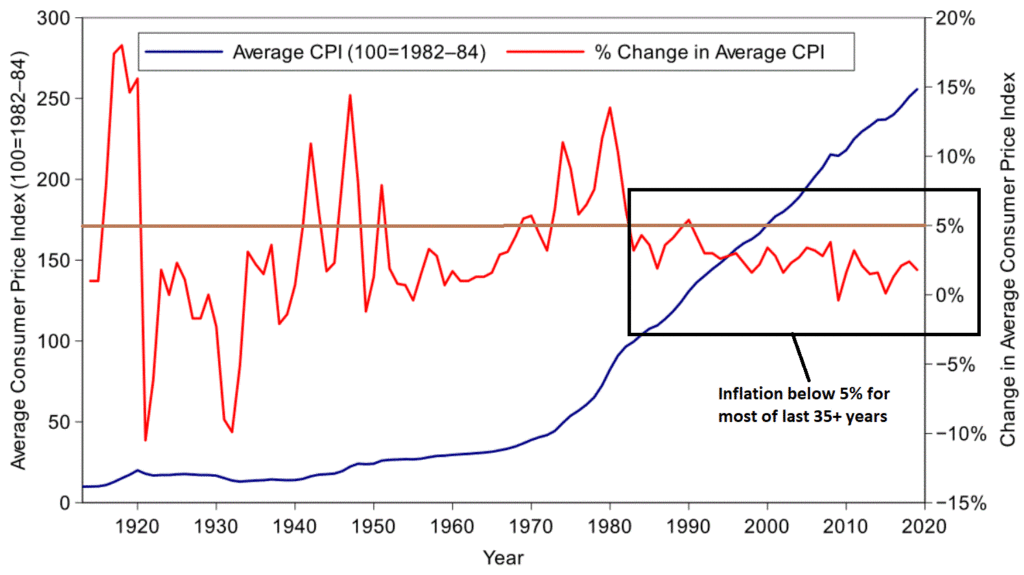
Figure 1 – The Consumer Price Index (1913-2020)
Things to note, focusing on 1930 forward to the present:
*In the 1930’s we had deflation (actually much worse than inflation as the economy essentially spirals lower and slower) with the CPI reaching almost -10%
*There were peaks in the 15% range in the late 1940’s and late 70’s/early 80’s
*As you can see in the black box to the right hand side, inflation has been less than 5% annually for most of the last 35 years
As a result, most investors have been conditioned to not fret too much about inflation. And any time spent actually worrying about inflation in the past several decades has been a waste of good anxiety.
But nothing lasts forever. Especially in the financial markets, where things tend to move in a cyclical nature over long periods of time. To illustrate this point with a random, yet related example, consider Figure 2 which displays the yield on 30-year treasury bonds since 1942.
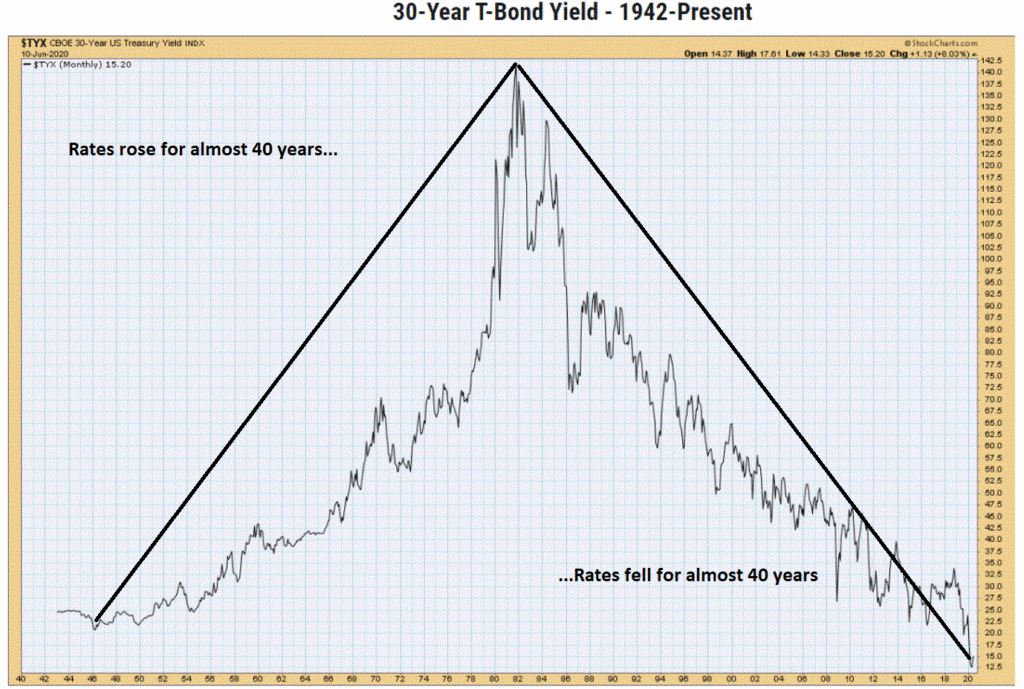
Figure 2 – 30-year treasury bond yield (1942-2020) (Courtesy: www.StockCharts.com)
Since the early 1980’s, investors have been nicely rewarded for holding bonds – especially long-term bonds. But from the mid 1950’s into 1980 the experience was much different (rising yields equate to lower bond prices). Presumably someday rates will rise again and an entire generation of bond investors will have no idea what is happening to their investments (see here, here, here and here). But for now, we are focusing on inflation.
How to Know When to Worry About Inflation
I’ll give you three things to follow.
#1. Gold
In a recent paper co-authored by legendary trader Paul Tudor Jones (see here) the authors laid out the case for higher inflation in the years ahead and suggested gold bullion could reach $2,400 an ounce. Is this a possibility? Absolutely.
Figure 3 displays from 2005 through 2012:
*ticker GLD (an ETF that tracks the price of gold bullion)
*my own index called ANTIGLD3 (components highlighted on right) with a Front Weighted Moving Average and a 55-week exponential moving average)
The ANTIGLD3 Index is a contrarian trend-following tool, i.e., when this index is in a downtrend it is bullish for gold and vice versa.
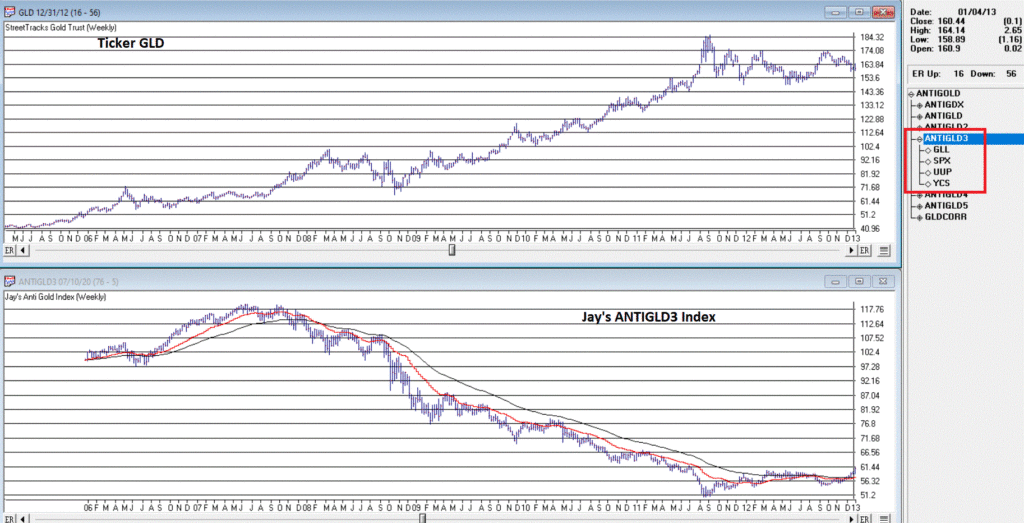
Figure 3 – Ticker GLD versus Jay’s ANTIGLD3 Index (2005-2012) (Courtesy AIQ TradingExpert)
Figure 4 displays the same tickers from 2012 into 2020
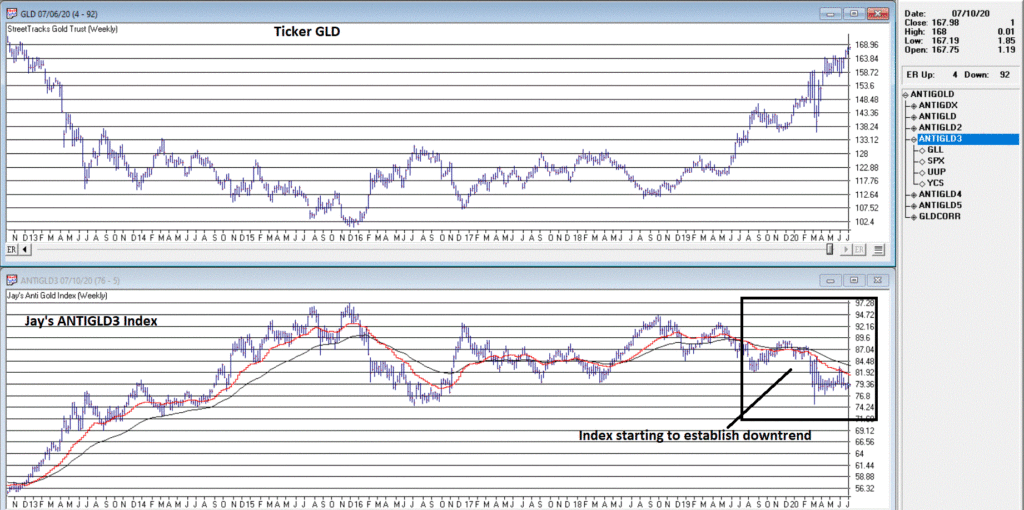
Figure 4 – Ticker GLD versus Jay’s ANTIGLD3 Index (2012-2020) (Courtesy AIQ TradingExpert)
The key thing to note in Figure 4 is that after several years of whipsaws the two trend-following indicators applied to ANTIGLD3 are in a clear downtrend (since this is a contrarian index that means it is purportedly bullish for gold).
So, is it off to the races for gold? I can’t say for sure. But it appears to be trying. Also note that gold can rally significantly in price for reasons other than inflation (see 2005-2011 rally)
I have positions in gold and gold stocks but not huge ones. For whatever reason, so far, I am “not feeling it.” As you will see in a moment, some inflation trend-following “things” that I watch have yet to confirm that inflation is an imminent threat at this exact moment.
But I am holding my positions just in case gold itself is the actual “leading indicator” in this story.
#2. The Aussie Dollar versus its 24-month moving average
I covered this in detail here so will not get too in-depth here. But you can get the gist of it pretty simply from Figure 5. The top chart is ticker FXA with a 24-month exponential moving average and the bottom chart is ticker GSG which tracks the Goldman Sachs Commodity Index.
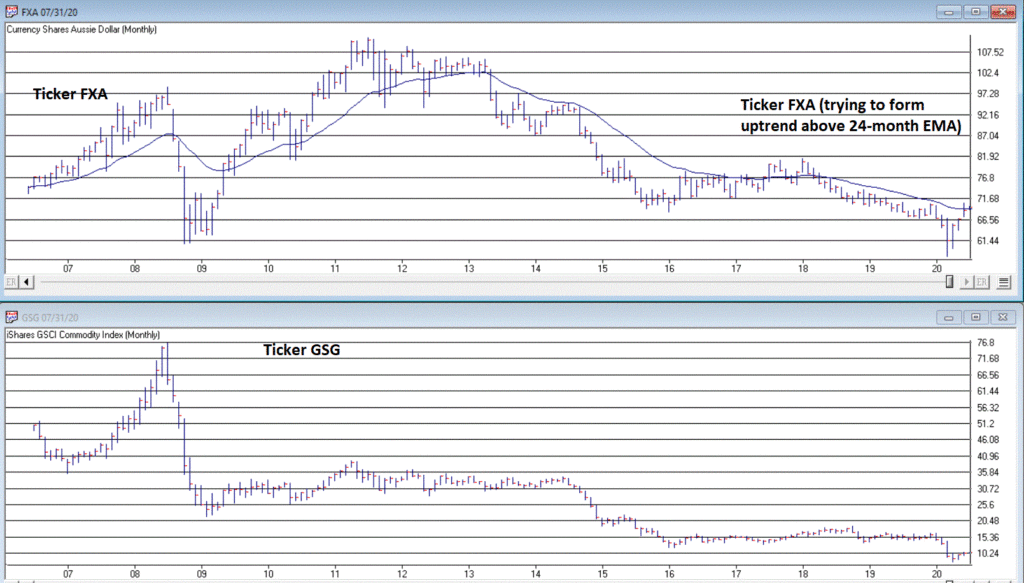
Figure 5 – Ticker FXA (top) and ticker GSG (bottom) (Courtesy AIQ TradingExpert)
Long story short, commodities – or “hard assets”, are typically a good place to be during a period of sharply rising and/or high inflation – perform better when FXA is in an uptrend (i.e., above the 24-month EMA) than when below. As of early July FXA has just moved above its 24-month EMA. For the record, I usually only consider this at month-end. So, check back after 7/31.
If FXA establishes an uptrend, the likelihood of higher prices for commodities – including gold – rises. Thus, an uptrend for FXA would be another potential warning sign of impending inflation.
#3. TIPs versus Long-Term Treasuries
TIPs bonds are Treasury Inflation Protected securities, i.e., the principal can rise as inflation (based on the Consumer Price Index) rises (see here). In other words, a TIP bond can gain value as inflation rises. Long-term treasuries on the other hand are the securities most likely to get hurt by a rise in inflation (as the rate of return is fixed once you buy the bond and a rise in inflation can reduce the future value and/or purchasing power of that fixed return).
So, in a low inflationary period we typically see TIPs fall relative to long-term treasuries and during rising inflation we would expect to see TIPS rise relative to long-term bonds.
Figure 6 displays the chart of ticker TIP relative to ticker TLT on a weekly basis (with a 200-wekk moving average) from www.StockCharts.com.
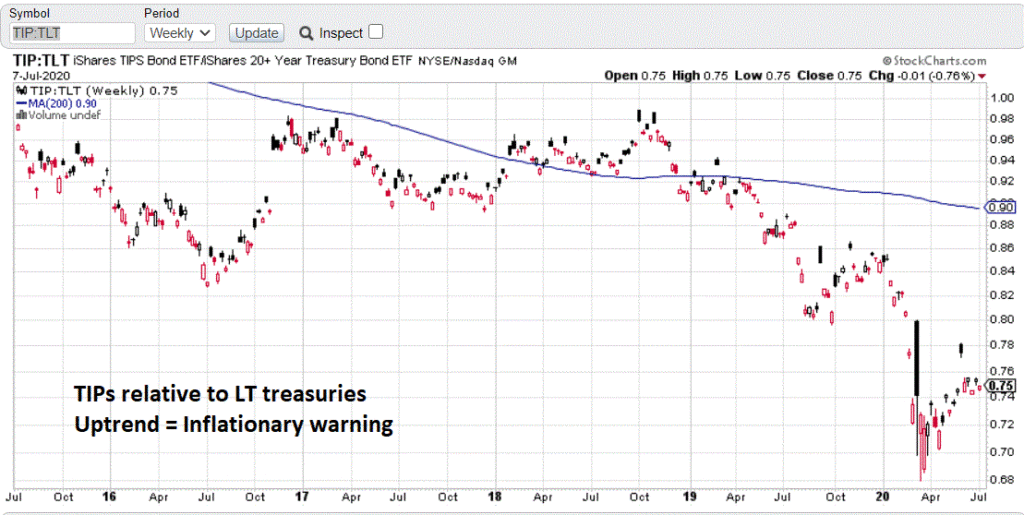
Figure 6 – Ticker TIP relative to ticker TLT (weekly) still trending lower (Courtesy: www.StockCharts.com)
The bottom line: While gold itself is attempting to breakout to the upside and the Aussie Dollar is trying to establish an uptrend, the TIP:TLT relationship is not presently indicating any meaningful inflationary concerns.
Summary
Inflation has been low for about 35 years. But as they say, “don’t go to sleep on it.”
If you want to be objectively prepared, keep an eye on:
*Gold bullion (in an uptrend, confirmed by a downtrend in my “anti-gold index”)
*The Aussie Dollar (No trend at the moment, but trying to establish an uptrend)
*Ticker TIP versus ticker TLT (Nowhere close to an uptrend right now)
So one up, one down and one sideways. But pay close attention going forward.
If and when all three establish uptrends, the game we’ve all been playing for several decades will likely change dramatically.
See also Jay Kaeppel Interview in July 2020 issue of Technical Analysis of Stocks and Commodities magazine
See also Jay’s “A Strategy You Probably Haven’t Considered” Video
See also Video – The Long-Term…Now More Important Than Ever
Jay Kaeppel
Disclaimer: The information, opinions and ideas expressed herein are for informational and educational purposes only and are based on research conducted and presented solely by the author. The information presented represents the views of the author only and does not constitute a complete description of any investment service. In addition, nothing presented herein should be construed as investment advice, as an advertisement or offering of investment advisory services, or as an offer to sell or a solicitation to buy any security. The data presented herein were obtained from various third-party sources. While the data is believed to be reliable, no representation is made as to, and no responsibility, warranty or liability is accepted for the accuracy or completeness of such information. International investments are subject to additional risks such as currency fluctuations, political instability and the potential for illiquid markets. Past performance is no guarantee of future results. There is risk of loss in all trading. Back tested performance does not represent actual performance and should not be interpreted as an indication of such performance. Also, back tested performance results have certain inherent limitations and differs from actual performance because it is achieved with the benefit of hindsight.

