Category Archives: jay kaeppel

Financials – Danger or Opportunity? Or Both?

To say that there is has been and remains a great deal of angst in the financial markets is a bit of an understatement. This is especially true when it comes to the financial sector.  The financial sector has a fairly high correlation to treasury yields (ticker FSRBX – Fidelity Select Banking Portfolio has a 0.52 correlation to ticker TNX – which tracks 10-year treasury yields).  As yields have plummeted so has the financial sector.  During the recent decline, FSRBX plunged -51% from its December 2019 peak.  With little expectation of higher rates anytime soon a lot of investors are understandably wary of diving into this sector.

But much like with the energy sector, the old adage that the time to buy is when there is “blood in the streets”, should give one pause before they turn their back completely on the financial sector.  For the time being I am keeping my eye on a little-known indicator called “Vixfixaverageave” (yes, I agree it is a really bad name).  The calculations for this indicator appear at the end of this article.  The reason I am watching it right now is that it recently reached a very oversold level that has helped to highlight some useful buying opportunities for financials in the past.

Ticker FSRBX

Figure 1 displays a monthly chart for FSRBX in the top clip and the Vixfixaverageave indicator in the bottom clip.  Note that the indicator rose above 72 at the end of April 2020.  As you can see there have been four previous occasions when this indicator, a) exceeded 72 and then b) reversed lower for one month.  For arguments sake we will call that a buy signal.

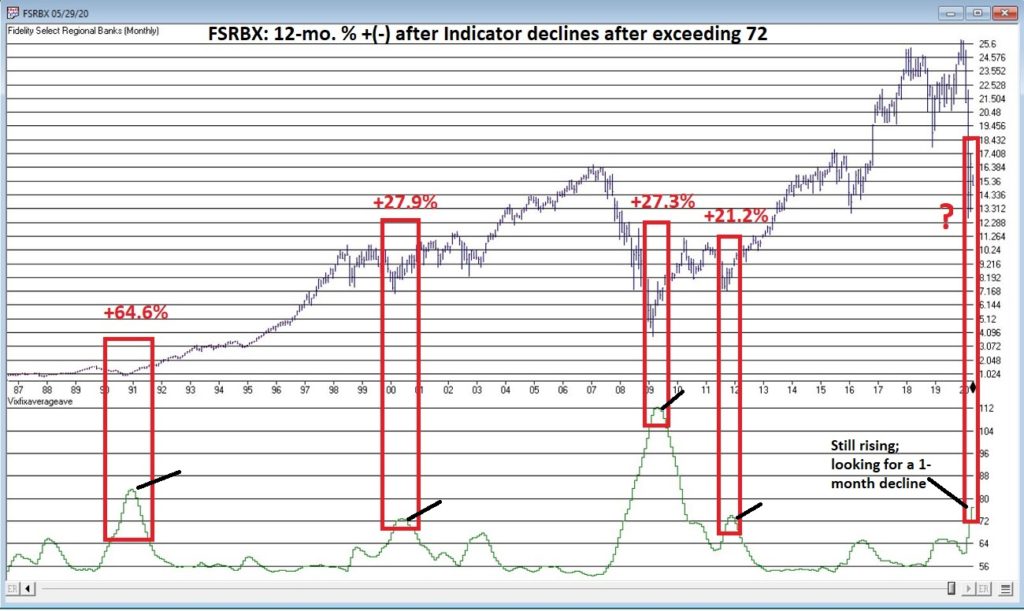
Figure 1 – Ticker FSRBX with indicator Vixfixaverageave (Courtesy AIQ TradingExpert)

Figure 2 displays the 1 to 5 year % + (-) for FSRBX following the four previous signals.  As you can see, they all proved to be exceptional buying opportunities.

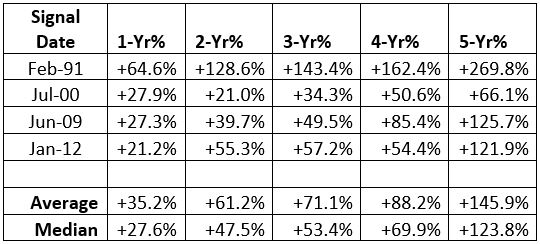
Figure 2 – FSRBX returns 1 to 5 years after signal

Now for the disappointing news: if you are thinking that all we have to do is wait for this indicator to finally top out and that big profits are “guaranteed” to roll in, you are making a mistake.  As they say, “past performance is no guarantee of future results.”  (Sorry, I don’t make the rules).  So, when the Vixfixaverageave monthly reading for FSRBX does finally roll over, the proper course of action would be to:

*Decide if you really want to act based on the signal

*Decide how much capital you are willing to commit

*Decide how much of that capital you are actually willing to risk – i.e. will you stop out if a loss exceeds x%, or do you plan to simply hold it for 1 to 5 years regardless?

Summary

There are a million and one ways to trigger an entry signal.  The one discussed herein is just one more.  What really separates the winners from the losers is the answers to the three questions just posed.

Vixfixaverageave Calculations 

EDITTORS NOTE: The code sections can be copied and pasted into AIQ EDS or you can download the indicator code in an EDS file from here and save it to your /wintes32/EDS Strategies folder.

This indicator is based on another indicator called VixFix which was developed many years ago by Larry Williams.

hivalclose is hival([close],22).  <<<<<The high closing price in that last 22 periods

vixfix is (((hivalclose-[low])/hivalclose)*100)+50. <<<(highest closing price in last 22 periods minus current period low) divided by highest closing price in last 22 periods (then multiplied by 100 and 50 added to arrive at vixfix value)

vixfixaverage is Expavg(vixfix,3). <<< 3-period exponential average of vixfix

vixfixaverageave is Expavg(vixfixaverage,7). <<<7-period exponential average of vixfixaverage

Jay Kaeppel

Disclaimer: The information, opinions and ideas expressed herein are for informational and educational purposes only and are based on research conducted and presented solely by the author.  The information presented represents the views of the author only and does not constitute a complete description of any investment service.  In addition, nothing presented herein should be construed as investment advice, as an advertisement or offering of investment advisory services, or as an offer to sell or a solicitation to buy any security.  The data presented herein were obtained from various third-party sources.  While the data is believed to be reliable, no representation is made as to, and no responsibility, warranty or liability is accepted for the accuracy or completeness of such information.  International investments are subject to additional risks such as currency fluctuations, political instability and the potential for illiquid markets.  Past performance is no guarantee of future results.  There is risk of loss in all trading.  Back tested performance does not represent actual performance and should not be interpreted as an indication of such performance.  Also, back tested performance results have certain inherent limitations and differs from actual performance because it is achieved with the benefit of hindsight.

The Ultimate Ugly Contrarian Play

They always say you should buy when there is “blood in the street.”  They also say, “buy them when nobody wants them.”  So, let’s consider today what could be the most unloved, bombed out, everybody hates it “thing” in the world – coal.

Ugh, just the mention of the word coal elicits a recoiling response.  “Dirty energy!”  “Climate change inducing filth!” “Ban coal!”.  And so and so forth.  And maybe they have a point.  But “they” also say “facts are stubborn things” (OK, for the record, I think it’s a different “they” who says that but never mind about that right now).

So here is a stubborn fact: coal supplies about a quarter of the world’s primary energy and two-fifths of its electricity.  As I write, two of the fastest growing economies (at least they were as of a few months ago) – China and India – are not only heavily reliant upon coal for energy, but are still building more and more coal-fired plants.  Now I am making no comment on whether this is a good thing or a bad thing but the point is, it most definitely is a “thing.”

So however one feels about coal, the reality is that it is not going to go away anytime soon.  Does this mean it will “soar in value” anytime soon – or even ever for that matter?  Not necessarily.  But as an unloved commodity it’s sure is hard to beat coal.  And as “they” (they sure are a bunch of know it all’s they?) say, “opportunity is where you find it.” 

Ticker KOL is an ETF that invests in coal industry related companies.  And what a dog it has been.  Figure 1 displays a monthly chart of price action.  Since peaking in June 2008 at $60.80 a share, it now stands at a measly $6.29 a share, a cool -89.6% below its peak.  And like a lot of things it has been in a freefall of late.

Figure 1 – Ticker KOL Monthly chart (Courtesy AIQ TradingExpert)

So, is this a great time to buy KOL?  That’s not for me to say.  But for argument’s sake, Figure 2 displays a weekly chart of KOL with an indicator I call Vixfixaverageave (I know, I know), which is a version of an indicator developed a number of years ago by Larry Williams (Indicator code is at the end of the article).

Figure 2 – KOL weekly chart with Vixfixaverageave indicator (Courtesy AIQ TradingExpert)

Note that Vixfixaverageave is presently above 90 on the weekly chart.  This level has been reached twice before – once in 2008 and once in 2016.  Following these two previous instances, once the indicator actually peaked and ticked lower for one week, KOL enjoyed some pretty spectacular moves. 

To wit:

*Following the 12/19/08 Vixfixaverageave peak and reversal KOL advanced +252% over the next 27.5 months

*Following the 2/19/16 Vixfixaverageave peak and reversal KOL advanced +182% over the next 23.5 months

When will Vixfixaverageave peak and reverse on the weekly KOL chart?  There is no way to know.  One must just wait for it to happen.  And will it be time to buy KOL when this happens?  Again, that is not for me to say.  None of this is meant to imply that the bottom for KOL is an hand nor that a massive rally is imminent.

Still, if there is anything at all to contrarian investing, its hard to envision anything more contrarian that KOL.

Vixfixaverageave Calculations

hivalclose is hival([close],22).  <<<<<The high closing price in that last 22 periods

vixfix is (((hivalclose-[low])/hivalclose)*100)+50. <<<(highest closing price in last 22 periods minus current period low) divided by highest closing price in last 22 periods (then multiplied by 100 and 50 added to arrive at vixfix value)

vixfixaverage is Expavg(vixfix,3). <<< 3-period exponential average of vixfix

vixfixaverageave is Expavg(vixfixaverage,7). <<<7-period exponential average of vixfixaverage

Jay Kaeppel

Disclaimer: The information, opinions and ideas expressed herein are for informational and educational purposes only and are based on research conducted and presented solely by the author.  The information presented does not represent the views of the author only and does not constitute a complete description of any investment service.  In addition, nothing presented herein should be construed as investment advice, as an advertisement or offering of investment advisory services, or as an offer to sell or a solicitation to buy any security.  The data presented herein were obtained from various third-party sources.  While the data is believed to be reliable, no representation is made as to, and no responsibility, warranty or liability is accepted for the accuracy or completeness of such information.  International investments are subject to additional risks such as currency fluctuations, political instability and the potential for illiquid markets.  Past performance is no guarantee of future results.  There is risk of loss in all trading.  Back tested performance does not represent actual performance and should not be interpreted as an indication of such performance.  Also, back tested performance results have certain inherent limitations and differs from actual performance because it is achieved with the benefit of hindsight.

Thoughts on the Energy Sector (just in case we ever leave our homes again)

In a few recent articles (for example here) I suggested that one day we would look back on this period as a terrific buying opportunity for energy related issues.  At the same time, I still have yet to become comfortable “pulling the trigger”.  Thank goodness for small favors.

Anyway, the overall sentiment still holds.  Energy is dirt cheap as are shares of most energy related stocks/ETFs etc.  Again, that doesn’t necessarily mean that now is the exact moment to “load up”.  To say that there is a wee bit of uncertainty regarding the future would be about the greatest understatement one could presently make.  Still, it is important to plan ahead and to be prepared when the time comes.  So, what follows should be considered “food for thought” and not “an immediate call to action.”

A Few Things Energy

Ticker TAN

According to conventional wisdom, the future is “green”.  I’ll be candid – I am all for green energy, as long as when I flip the switch the lights come on AND when I look at my energy bill I don’t faint.  So, let’s start with a “green” play.

Turth be told, ticker TAN (Invesco Solar Energy ETF) has never been much of a performer.  Still, its in the solar business which people keep telling me is “the future.”  In reality the primary thing it has going for it is that it hasn’t completely cratered to the same degree as just about every other stock in the energy sector.  As you can see in Figure 1, TAN actually bottomed out at $12.60 in 2012 and – despite a near 50% decline during the recent panic – is presently trading around $26 a share.  Not necessarily a screaming buy signal, but a nice relative performance as we will see in a moment.

Figure 1 – Ticker TAN (Courtesy AIQ TradingExpert)

Ticker UGA

In a sure “Sign of the Times”, the Good News is that gasoline prices are at their lowest levels in year, while the Bad News is that we don’t have anywhere to drive to except the grocery store.  Figure 2 displays the chart for ticker UGA – the United States Gasoline Fund, and ETF that tracks the price of gasoline.

While attempting to “pick a bottom” is a fool’s errand, the primary point is that it is not that hard to envision the price of this ETF being significantly higher at some point in the years ahead.  Whether an investor has the fortitude to weather whatever the short-term uncertainty and the patience to see how the long-term plays out are the primary issues associated with contemplating this ticker at the moment.

Figure 2 – Ticker UGA (Courtesy AIQ TradingExpert)

Ticker XLE

Ticker XLE is a play on the broad (mostly fossil fuel related) energy sector.  As you can see in Figure 3, XLE has plunged to price levels not since 2004. In addition, it presently yields roughly 8.8%.  That being said, an investor has to realistically expect that dividend payments in the hard-hit energy sector will see some significant cuts as things play out in the months ahead. 

With an oil price war in full swing, not to mention a sharp decline in demand for the foreseeable future due to the coronavirus pandemic, the fundamentals for this sector are unlikely to improve soon.  Nevertheless, the reality is that – at least for the time being – the world runs on crude oil.  As a result, the current price range may one day be looked back upon as a once-in-a-generation buying opportunity.

Figure 3 – XLE (Courtesy ProfitSource by HUBB)

Ticker PAGP

OK, let’s throw in one obscure, totally speculative – yet fundamentally intriguing – thought for consideration.  Ticker PAGP (Plains GP Holdings, L.P.).  Here is what they do (straight from their website):

“Plains engages in the transportation, storage, terminalling, and marketing of crude oil and refined products, as well as in the storage of natural gas, and the processing, transportation, fractionation, storage, and marketing of natural gas liquids.

Assets include:

*17,965 miles of active crude oil and NGL pipelines and gathering systems (emphasis mine as these things will continue to function as long as crude and NG need to be moved – which they do)

*50 barges and 20 transport tugs

*109 million barrels of storage capacity

*1,600+ trucks and trailers

*9,100 rail cars”

The bottom line is that as long as crude oil and natural gas needs to be moved, PAGP has a niche in which to operate.  For the record, at $6.35 a share the stock’s present dividend comes to a yield of 22.7%.  Certainly, the prospect of a significant dividend cut is a Signiant risk associated with this stock.  But for the moment anyway the price is near an all-time low and the dividend yield is attractive.

Figure 4 – Ticker PAGP (Courtesy ProfitSource by HUBB)

Summary

As allows, DO NOT look upon what I have written as “recommendations.”  Particularly in the current environment.  They are simply “food for thought.”

Given current fundamentals:

*An ongoing oil price war (making drilling and refining unprofitable for many companies)

*An economy on shutdown (which cripples demand)

*An existential struggle between “green” energy and “traditional” fossil fuel-based sources (which creates uncertainty about future expectations)

All combine to make the energy sector a giant question mark at the present time.  But if the old adage that the time to buy is when there is “blood in the streets”, than investors might be well served in the long run to start thinking now about how much capital they might be willing to commit to energy, and what type of catalyst might prompt them to actually “take the plunge.”

Jay Kaeppel

Disclaimer: The information, opinions and ideas expressed herein are for informational and educational purposes only and are based on research conducted and presented solely by the author.  The information presented does not represent the views of the author only and does not constitute a complete description of any investment service.  In addition, nothing presented herein should be construed as investment advice, as an advertisement or offering of investment advisory services, or as an offer to sell or a solicitation to buy any security.  The data presented herein were obtained from various third-party sources.  While the data is believed to be reliable, no representation is made as to, and no responsibility, warranty or liability is accepted for the accuracy or completeness of such information.  International investments are subject to additional risks such as currency fluctuations, political instability and the potential for illiquid markets.  Past performance is no guarantee of future results.  There is risk of loss in all trading.  Back tested performance does not represent actual performance and should not be interpreted as an indication of such performance.  Also, back tested performance results have certain inherent limitations and differs from actual performance because it is achieved with the benefit of hindsight.

Houston, We Have a Parabola

Everybody likes it when an asset that they hold goes up in price.  In fact, the more the better.  But only to a point as it turns out.  When price gets carried away to the upside – we trader types typically refer to it as a “going parabolic”, i.e., a situation when prices are essentially rising straight up – it almost invariably ends very badly.  We have seen a couple of examples recently.

Palladium

Palladium is a metal that according to Bloomberg’s “About 85% of palladium ends up in the exhaust systems in cars, where it helps turn toxic pollutants into less-harmful carbon dioxide and water vapor. It is also used in electronics, dentistry, medicine, hydrogen purification, chemical applications, groundwater treatment, and jewelry. Palladium is a key component of fuel cells, which react hydrogen with oxygen to produce electricity, heat, and water.”

And it was pretty hot stuff for some time.  At least until it wasn’t.  As a proxy we will look at the ETF ticker symbol PALL, which attempts to track the price of palladium. 

*From January 2016 into January 2018, PALL rose +139%

*In the next 7 months it declined by -26%

*And then the fun really began – Between August 2018 and February 2020 PALL rose +245%, with a +110% gain occurring in the final 5+ months of the advance

What a time it was.  Until it wasn’t anymore.

Since peaking at $273.16 a share on 2/27/2020, PALL plunged -50% in just 12 trading days.  To put it another way, it gave back an entire year’s worth of gains in just 12 trading days.

Was there any way to see this coming?  Maybe. In Figure 1 we see a monthly chart with an indicator called “RSI32” in the bottom clip.  This indicator is derived by taking the 2-month average of the standard 3-month Relative Strength Index (RSI). 

Figure 1 – PALL with RSI32 (Courtesy AIQ TradingExpert)

Notice that historically when the RSI32 indicator gets above 96, trouble tends to follow pretty quickly.  See Figure 2

Figure 2 – PALL: Peaks in RSI32 and the subsequent maximum drawdown (Courtesy AIQ TradingExpert)

T-Bonds

During the panic sell-off in the stock market in recent weeks, treasury bonds became very popular as a “safe haven” as investors piled out of stocks and into the “safety” of U.S. Treasuries.  What too many investors appeared to forget in their haste was that long-term treasury can be extremely volatile (for the record, short and intermediate term treasuries are much less volatile than long-term bonds and are much better suited to act as a safe haven).  Likewise – just an opinion – buying a 30-year bond paying 1% per year is not entirely unlike buying a stock index fund when the market P/E Ratio is over 30 – there just isn’t a lot of underlying value there. So you are essentially betting on a continuation of the current trend and NOT on the ultimate realization of the underlying value – because there really isn’t any.

Anyway, Figure 3 displays a monthly chart of ticker TLT – an ETF that tracks the long-term treasury – with the RSI32 indicator in the bottom clip. 

Figure 3 – TLT with RSI32 (Courtesy AIQ TradingExpert)

Bond price movement is typically not as extreme and volatile as Palladium, so for bonds a RSI32 reading above 80 typically indicates that potential trouble may lie ahead. 

As of the close of 3/17/20, TLT was almost -15% off of its high in just 6 trading days. We’ll see where it goes from here.

Tesla (Ticker TSLA)

Anytime you see what is essentially a manufacturing company – no matter how “hot”, “hip”, or “cool” the product they build – go up 200% in 2 months’ time, the proper response is NOT giddy delight.  The proper response is:

*If you DO own the stock, either set a trailing stop or take some profits immediately and set a trailing stop for the rest

*If you DO NOT own the stock, DO NOT allow yourself to get sucked in

Take TSLA in Figure 4 for instance. By February 2020 TSLA was up almost 200% in 2 months and almost 450% in 8 months.  The RSI32 indicator was above 96 – a stark warning sign. 

19 trading days after making its closing high, TSLA is down -59%.

Figure 4 – TSLA with RSI32 (Courtesy AIQ TradingExpert)

Summary

Simply remember this.  Parabolic price moves are:

*Exciting while they are unfolding

*Disastrous when they end

Typically, the security in question gives back months – or in some case, years – worth of gains in a shockingly short period of time.

Beware the parabola.

Jay Kaeppel

Disclaimer: The information, opinions and ideas expressed herein are for informational and educational purposes only and are based on research conducted and presented solely by the author.  The information presented does not represent the views of the author only and does not constitute a complete description of any investment service.  In addition, nothing presented herein should be construed as investment advice, as an advertisement or offering of investment advisory services, or as an offer to sell or a solicitation to buy any security.  The data presented herein were obtained from various third-party sources.  While the data is believed to be reliable, no representation is made as to, and no responsibility, warranty or liability is accepted for the accuracy or completeness of such information.  International investments are subject to additional risks such as currency fluctuations, political instability and the potential for illiquid markets.  Past performance is no guarantee of future results.  There is risk of loss in all trading.  Back tested performance does not represent actual performance and should not be interpreted as an indication of such performance.  Also, back tested performance results have certain inherent limitations and differs from actual performance because it is achieved with the benefit of hindsight.

March and April to the Rescue?

Well that got ugly quick.  For the record, if you have been in the markets for any length of time you have seen this kind of action plenty of times.  An index, or stock, or commodity or whatever, trends and trends and trend steadily and relentlessly higher over a period of time.  And just when it seems like its going to last forever – BAM.  It gives back all or much of its recent rally gains very quickly.  Welcome to the exciting world of investing.

I make no claims of “calling the top” – because I never have actually (correctly) called one and I don’t expect that I ever will.  But having written Part I and Part II of articles titled “Please Take a Moment to Locate the Nearest Exit” in the last week, I was probably one of the least surprised people at what transpired in the stock market in the last few sessions. 

Of course the question on everyone’s lips – as always in this type of panic or near panic situation – is, “where to from here?”  And folks if I knew the answer, I swear I would tell you.  But like everyone else, I can only assess the situation, formulate a plan of action – or inaction, as the case may be – and act accordingly.  But some random thoughts:

*Long periods of relative calm followed by extreme drops are more often than not followed by periods of volatility.  So, look for a sharp rebound for at least a few days followed by another downdraft and so on and so forth, until either:

a) The market bottoms out and resumes an uptrend

b) The major indexes (think Dow, S&P 500, Nasdaq 100, Russell 2000) drop below their 200-day moving averages.  As of the close on 2/25 both the Dow and the Russell 2000 were below their 200-day moving average.  That would set up another a) or b) scenario.

If the major indexes break below their long-term moving averages it will either:

a) End up being a whipsaw – i.e., the market reverses quickly to the upside

b) Or will be a sign of more serious trouble

The main point is that you should be paying close attention in the days and weeks ahead to the indexes in Figure 1.

Figure 1 – Major indexes with 200-day moving averages (Courtesy AIQ TradingExpert)

One Possible Bullish Hope

One reason for potential optimism is that the two-month period of March and April has historically been one of the more favorable two-month periods on an annual basis.  Figure 2 displays the cumulative price gain achieved by the S&P 500 Index ONLY during March and April every year since 1945.  The long-term trend is unmistakable, but year-to-year results can of course, vary greatly.

Figure 2 – S&P 500 cumulative price gain March-April ONLY (1945-2019)

For the record:

S&P 500 March-AprilResult
Number of times UP55 (73%)
Number of times DOWN20 (27%)
Average UP%+5.0%
Average DOWN%(-3.4%)

Figure 3 – Facts and Figures

Will March and April bail us out?  Here’s hoping.

As an aside, this strategy is having a great week so far.

Jay Kaeppel

Disclaimer: The information, opinions and ideas expressed herein are for informational and educational purposes only and are based on research conducted and presented solely by the author.  The information presented does not represent the views of the author only and does not constitute a complete description of any investment service.  In addition, nothing presented herein should be construed as investment advice, as an advertisement or offering of investment advisory services, or as an offer to sell or a solicitation to buy any security.  The data presented herein were obtained from various third-party sources.  While the data is believed to be reliable, no representation is made as to, and no responsibility, warranty or liability is accepted for the accuracy or completeness of such information.  International investments are subject to additional risks such as currency fluctuations, political instability and the potential for illiquid markets.  Past performance is no guarantee of future results.  There is risk of loss in all trading.  Back tested performance does not represent actual performance and should not be interpreted as an indication of such performance.  Also, back tested performance results have certain inherent limitations and differs from actual performance because it is achieved with the benefit of hindsight.