Let’s face it, the human eye is naturally drawn to the “shiny object.” Hence the reason all the focus is on the Nasdaq Index (by the way, I think there was a glitch with my price quote software yesterday, because at one point it showed that the Nasdaq 100 Index was negative for the day. I contacted my quote service and pointed out this obvious error and apparently they fixed it because the Nasdaq – as it is supposed to be – was again showing a gain by the end of the day – while all the other indexes were down. But I digress.)
The bottom line is that the type of large-cap/technology related/growth stocks that are presently dominating the Nasdaq 100 Index are (or at least “have”) been the place to be since the market bottomed in March. Figure 1 displays the performance of ticker QQQ (an ETF that tracks the Nasdaq 100) relative to the performance of the Vanguard Total Stock Market ETF.

Figure 1 – Ticker QQQ versus ticker VTI (Courtesy StockCharts.com)
The message is pretty obvious, right? Pile into Apple, Microsoft and Amazon (which account for roughly 34% of the value of the index at the moment) and forget everything else!!!
Oh sure, if you want to toss in a little Facebook, Google, Tesla and NVIDIA just for “diversification”, that’s OK too. But avoid “everything else”!
And it’s a great strategy…. Well, as least as long as it lasts.
The “Stuff” Index
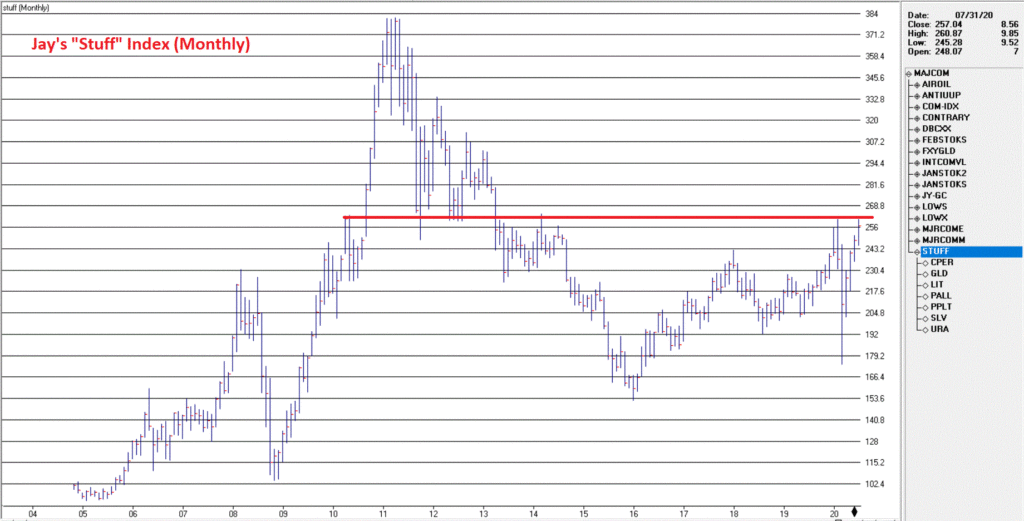
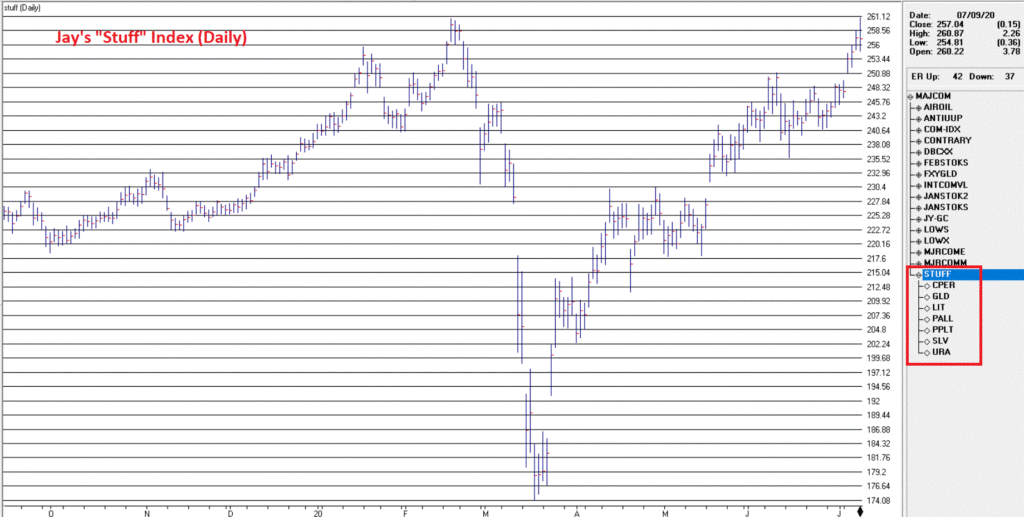
Anyway, I created my own index dubbed “Stuff” – it would probably be more accurate to call it the “metals and material” index, but I prefer “Stuff” (sorry, it’s just my nature). Figure 2 displays a monthly chart; Figure 3 displays a daily chart.

Figure 2 – Jay’s “Stuff” Index; Monthly (Courtesy AIQ TradingExpert)

Figure 3 – Jay’s “Stuff” Index; Daily (Courtesy AIQ TradingExpert)
This index bottomed on 3/18, since then it has climbed +44% (for the record, like everything else it has lagged the Nasdaq 100 which is up +50% over the same time, but it has outperformed all other relevant major stock market indexes).
The index is comprised of the following ETFs:
CPER (copper)
GLD (gold)
LIT (lithium)
PALL (palladium)
PPLT (platinum)
SLV (silver)
URA (uranium)
The top performer among this group since the 3/18 low is LIT which is up +84%.
OK, so this “Stuff” index has still underperformed the Nasdaq Index, so what’s the point?
The Point
Except for gold – which has rallied to a seven year high – no one it seems has the slightest idea that there is “life beyond” large-cap/tech/growth monolith presently sucking up all the sunshine.
Where do things go from here? Will Nasdaq keep running? Or is this rally overdone? And what about “Stuff”? Is there any guarantee that it’s strong run will continue? I don’t claim to have the answers.
As you can see in Figures 2 and 3, the Stuff Index is presently bumping up against resistance (while the Nasdaq has broken out to the upside and running to new highs).
So here is an interesting rhetorical question to ponder;
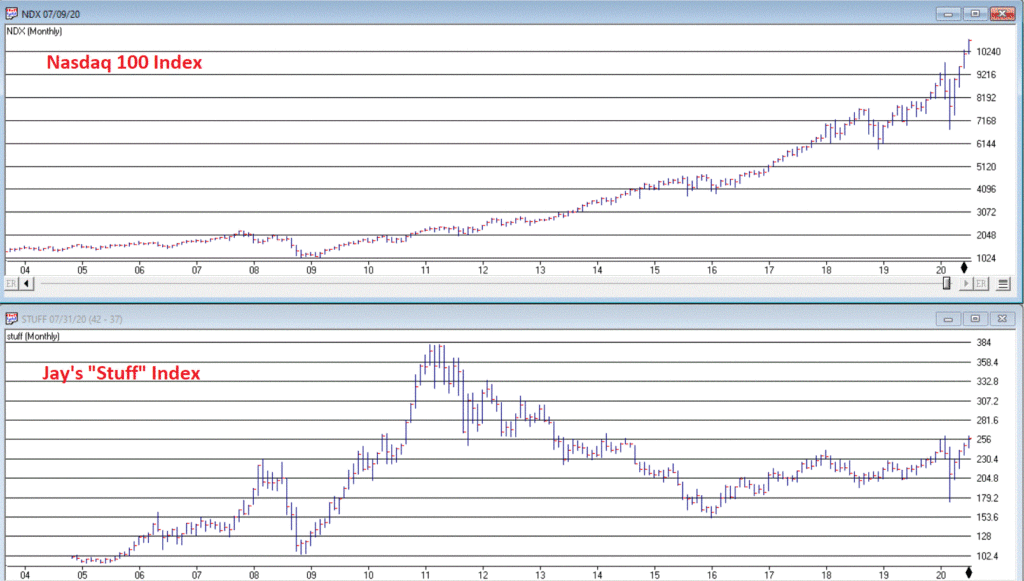
First look at Figure 4 which displays the monthly Nasdaq 100 on the top and my Stuff Index on the bottom.

Figure 4 – Nasdaq 100 Index vs. Stuff Index (Courtesy AIQ TradingExpert)
The question to ponder: Which has more upside potential going forward?
See also Jay Kaeppel Interview in July 2020 issue of Technical Analysis of Stocks and Commodities magazine
See also Jay’s “A Strategy You Probably Haven’t Considered” Video
See also Video – The Long-Term…Now More Important Than Ever
Jay Kaeppel
Disclaimer: The information, opinions and ideas expressed herein are for informational and educational purposes only and are based on research conducted and presented solely by the author. The information presented represents the views of the author only and does not constitute a complete description of any investment service. In addition, nothing presented herein should be construed as investment advice, as an advertisement or offering of investment advisory services, or as an offer to sell or a solicitation to buy any security. The data presented herein were obtained from various third-party sources. While the data is believed to be reliable, no representation is made as to, and no responsibility, warranty or liability is accepted for the accuracy or completeness of such information. International investments are subject to additional risks such as currency fluctuations, political instability and the potential for illiquid markets. Past performance is no guarantee of future results. There is risk of loss in all trading. Back tested performance does not represent actual performance and should not be interpreted as an indication of such performance. Also, back tested performance results have certain inherent limitations and differs from actual performance because it is achieved with the benefit of hindsight.

