The AI Market Timing model in TradingExpert Pro is an invaluable source for predicting direction changes in the stock market.
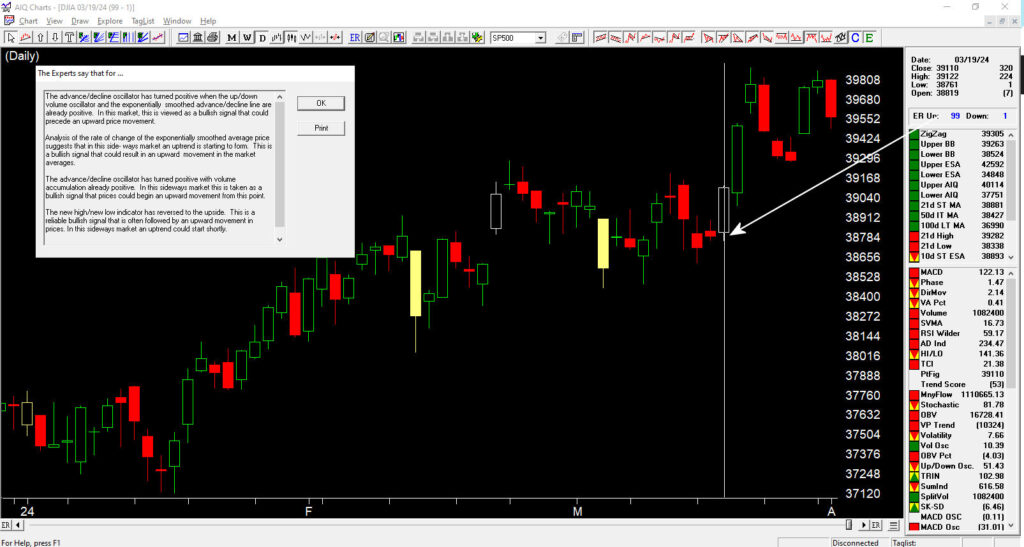
This Chart of our Dow30 with the New York Stock Exchange merged into the indicators shows our most recent Up signal of 99 -1 from 3-19-2024. Prices moved up from that point until the end of the month.

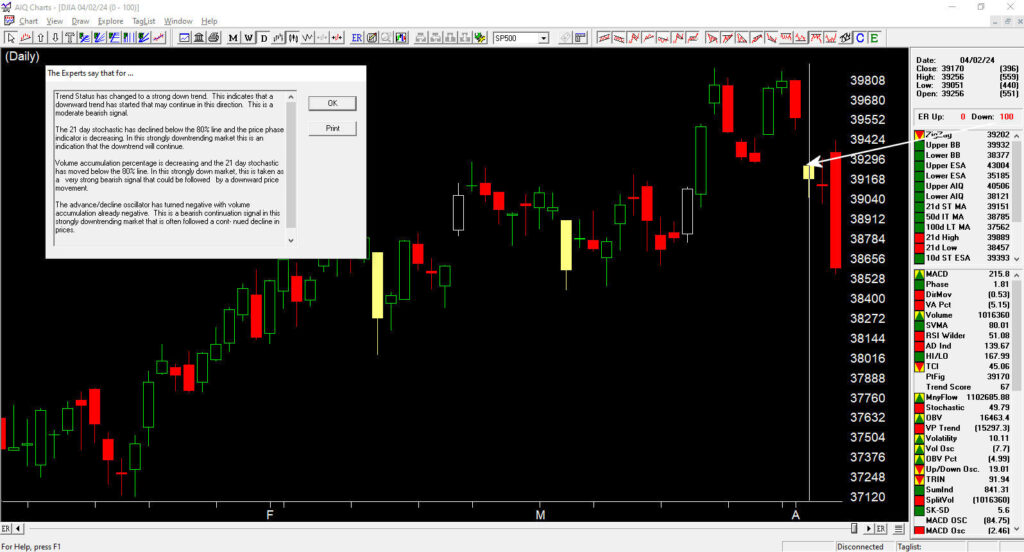
On 4-2-24 our AI model issued a 0-100 Down, below some of the major technical events that contributed to this signal.
Trend Status has changed to a strong downtrend. This indicates that a downward trend has started that may continue in this direction. This is a moderate bearish signal.
The 21-day stochastic has declined below the 80% line and the price phase indicator is decreasing. In this strongly down-trending market, this is an indication that the downtrend will continue.
The volume accumulation percentage is decreasing and the 21-day stochastic has moved below the 80% line. In this strongly down market, this is taken as a very strong bearish signal that could be followed by a downward price movement.
The advance/decline oscillator has turned negative with volume accumulation already negative. This is a bearish continuation signal in this strongly down-trending market that is often followed by a continued decline in prices.

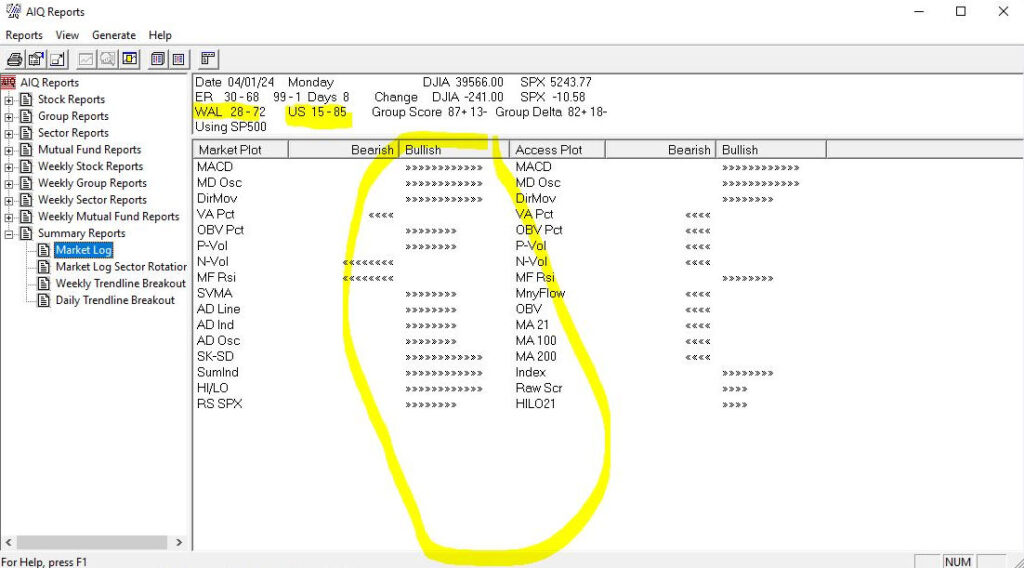
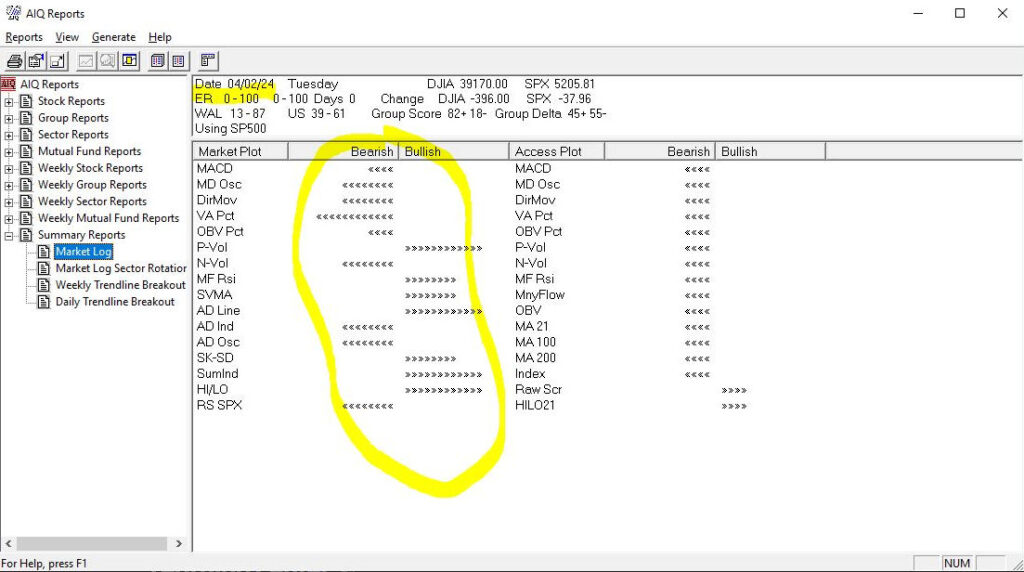
This transition from up market to down market can be seen just before this down signal by looking at the TradingExpert Pro market Log
The first log generated on 4–1-24 gives us in-depth internal information on the Dow and the NYSE. The indicators show a bullish bias is in place. The WAl and US numbers give us an internal look at the AI assessment of stocks and show a preponderance of signals to the downside. This is often an early sign of a pivot in the market.

The next day 4-2-24 with 0-100 down signal, the Market Log clearly shows a transition to more bearish levels in the indicators. The down signal is borne out by the follow-through to the downside. The Dow has returned to levels from 2 months ago.


