One of my (admittedly, potentially foolish) beliefs is that commodities will outperform stocks again someday. Possibly someday starting soon (roughly defined as anywhere from today to a year from today) and that the shift will be dramatic and last for a period of 3 to 8 years.
And no, I don’t think I could be any more vague. But I haven’t really “taken the plunge” (i.e., shifted money from the stock market into commodities in any meaningful way) yet. But I am keeping a close eye on things. Rather than rattled off another 1,000 words to explain, I will simply refer you to Figure 1 that tracks the ratio of the S&P Commodity Index to the S&P 500 Index.
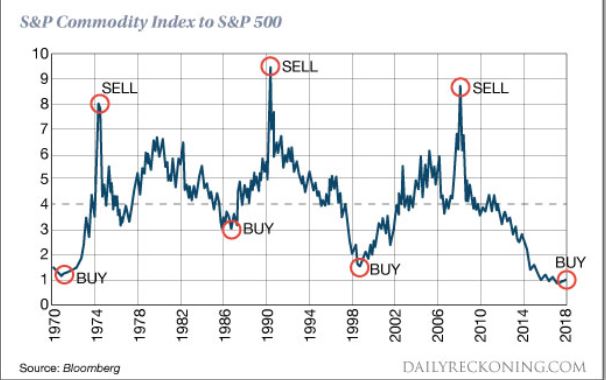
Figure 1 – Commodities versus Stocks (Source: www.DailyReckoning.com)
History suggests that “the worm will (eventually) turn.”
Sugar
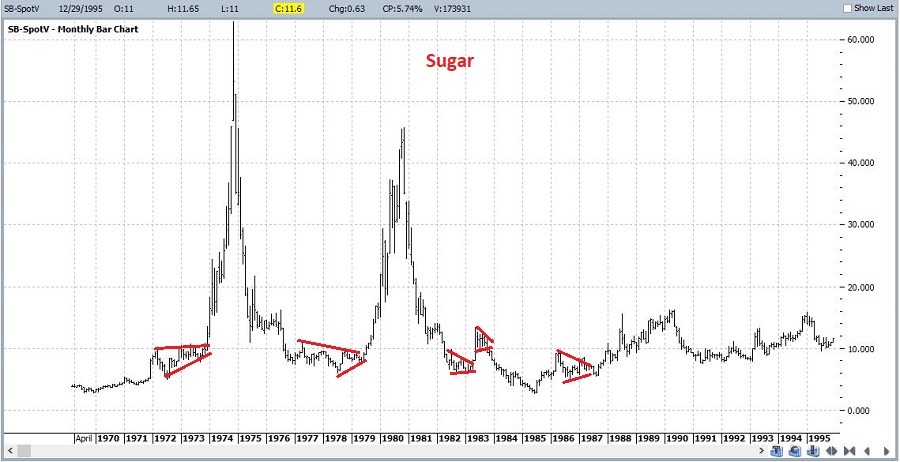
Let’s focus on one commodity for now. Sadly, it’s one of my favorites (ranks right up there with coffee). Sugar. As you can see in Figures 2 and 3, sugar has a history of contracting in price over a period of time and then alternately – and please excuse my use of the following overly technical terms – “swooping” or “soaring”.Figure 2 – Sugar 1970-1998 (Courtesy ProfitSource by HUBB)
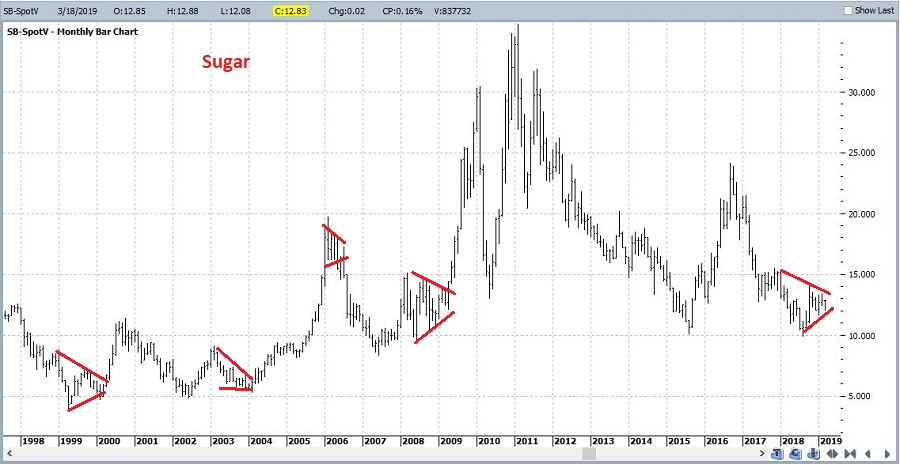
Figure 3 – Sugar 1998-2019 (Courtesy ProfitSource by HUBB)
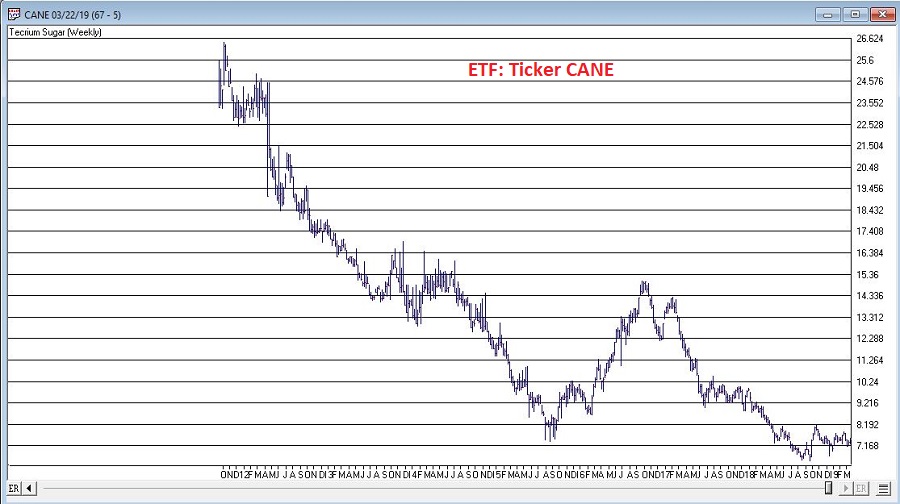
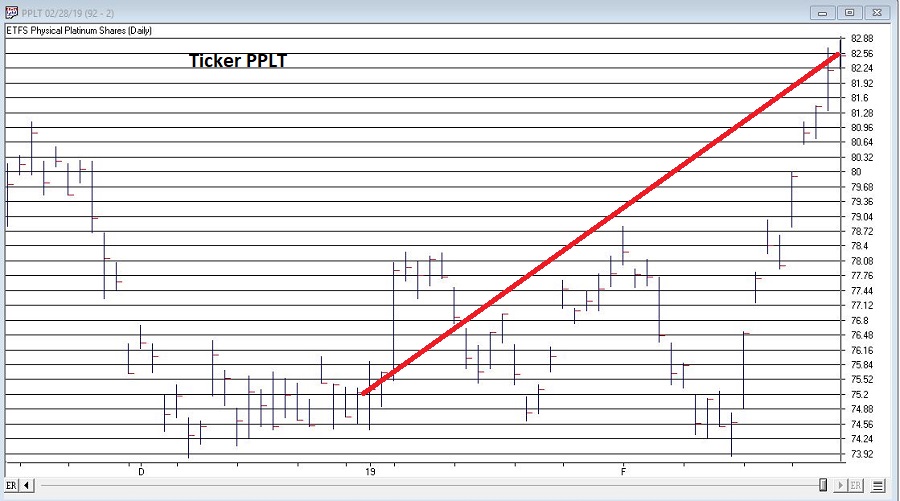
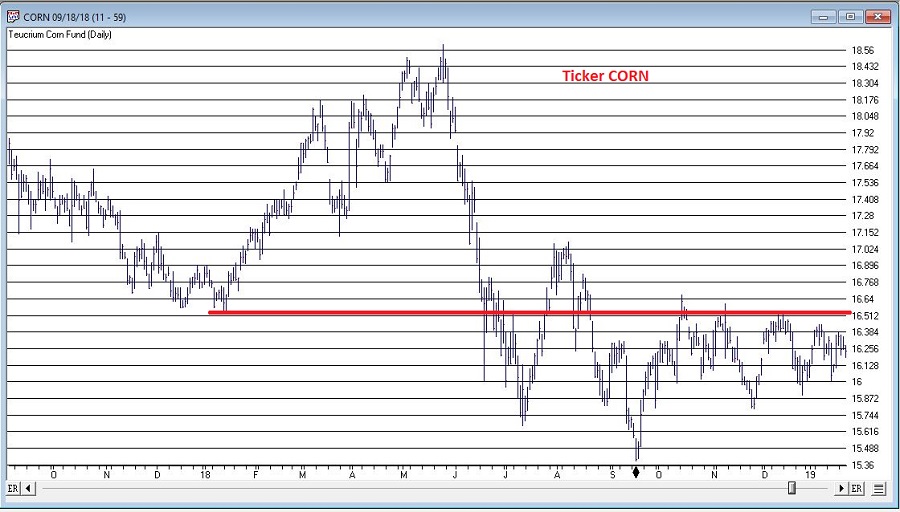
Sugar can be traded either in the futures market (each full one-point movement in price equates to $1,120 in contract value). An alternative for “normal people” is ticker CANE which is the Teucrium Sugar ETF which trades like shares of stock. See Figure 4.Figure 4 – ETF Ticker CANE (Courtesy AIQ TradingExpert)
As you can see, sugar has been “contracting” in price of late. Does this mean it is reading to “swoop” or “soar”? Possibly. But for those who want to play the bullish side, it is probably a bit too soon to dive in.
Seasonality in Sugar
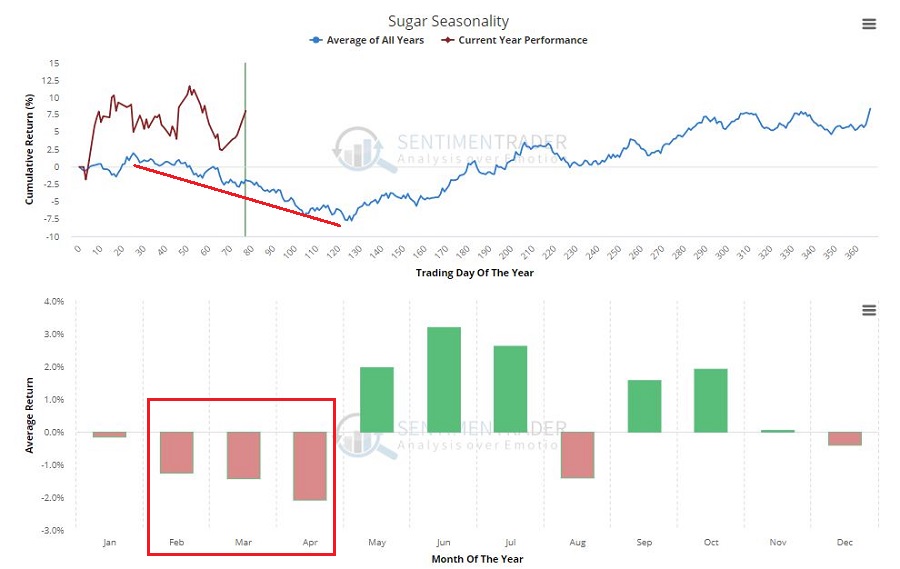
Figure 5 displays the annual seasonal trend in sugar. It should be noted that you should NOT expect every year to follow this trend. It is a display of previous historical tendencies and NOT a roadmap.Figure 5 – Sugar Annual Seasonal Trend (Courtesy Sentimentrader.com)
Still, the primary point is captured nicely in:
Jay’s Trading Maxim #92: One of the keys to long term success is committing capital where the probabilities are (or a least appear to be) in your favor.
February through April is NOT that time for anyone looking to play the long side of sugar.
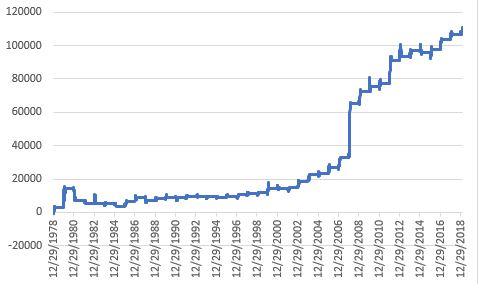
Figure 6 displays the cumulative results achieved by holding long one sugar futures contract ONLY during the months of February through April every year starting in 1970.
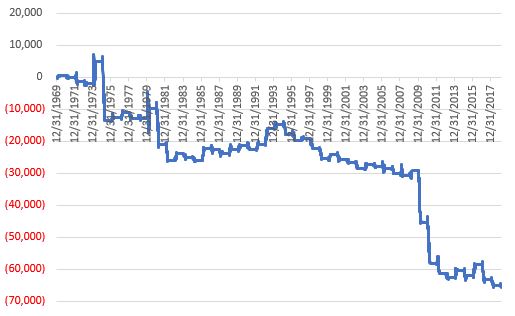
Figure 6 – Cumulative $+(-) holding long sugar futures Feb, Mar, Apr every year since 1970
Some things to note regarding sugar Feb through Apr:
*UP 18 times
*DOWN 31 times
*Average gain = +$2,201
*Average loss = (-$3,377)
*Largest gain = +$6,630 (1974)
*Largest loss = (-$18,424) (1975)
Summary
The point IS NOT to argue that sugar is doomed to plunge between now and the end of April, nor even to argue that it cannot rally strongly between now and then – because it can.
The point IS to merely point out that the odds do not presently favor the bulls, which means – well, see Trading Maxim #92 above.
Jay Kaeppel
Disclaimer: The data presented herein were obtained from various third-party sources. While I believe the data to be reliable, no representation is made as to, and no responsibility, warranty or liability is accepted for the accuracy or completeness of such information. The information, opinions and ideas expressed herein are for informational and educational purposes only and do not constitute and should not be construed as investment advice, an advertisement or offering of investment advisory services, or an offer to sell or a solicitation to buy any security.