Category Archives: stock market

Trend-Following in One Minute a Month (A Quick Update)

This article is intended to be a quick update to this article.  The original idea is based on the theory propounded by Ken Fischer that suggests that one should not worry about a “top” in the stock market until after the market goes at least 3 months without making a new high.

Three things to note:

*Like all trend-following methods the one detailed in the linked article will experience an occasional whipsaw, i.e., a sell signal at one price followed some time later by a new buy signal with the market at a higher price.

*Like any good trend-following method the real purpose is to help you avoid some significant portion of any major longer-term bear market, i.e., 1973-74, 2000-2002, 2007-2009).

*The secondary purpose is to relieve an investor of that constant “Is this the top, wait, what about this this, this looks like the top, OK never mind, but this, this time it definitely has to be the top” syndrome.

The Rules

For a full explanation of the rules please read the linked article.  In general, though:

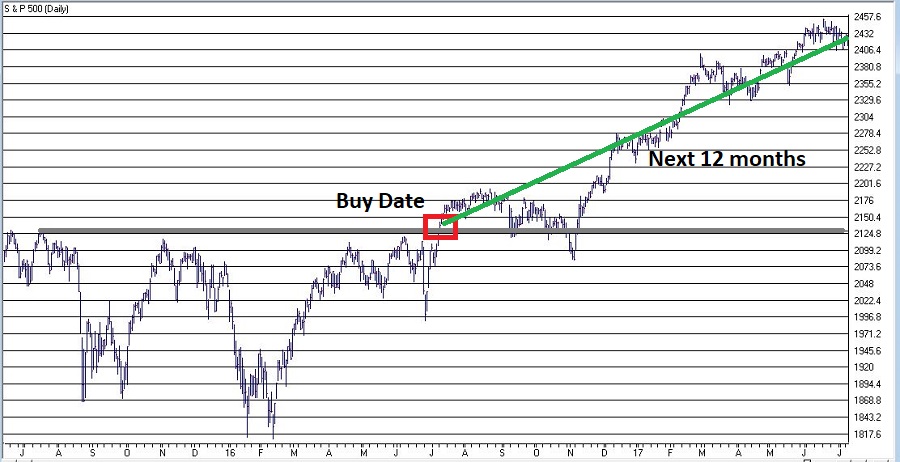
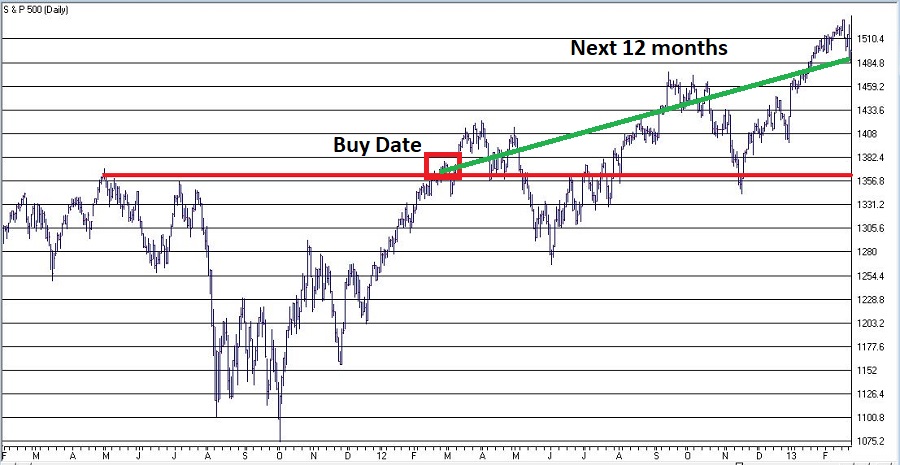
*A “Sell alert” occurs when the market makes a 6-month high, then goes 3 full calendar months without piercing that high

*The “trigger” price is the lowest low for the 3 months following the previous high

*A “Sell signal” occurs at the end of the month IF the “trigger” price is pierced to the downside during the current month

*The “trigger” is no longer valid if the S&P 500 makes a high above the high for the previous 6 months prior to an actual “Sell signal”

*If a “Sell signal” occurs then a new “Buy signal” occurs when the S&P 500 makes a high above the high for the previous 6 months

Sounds complicated, but its’s not.  Figure 1 displays the signals and alerts and trigger prices since 2005.

Green Arrows = Buy Signal

Red Arrows = Sell Signal

Red horizontal lines = Sell trigger price

1

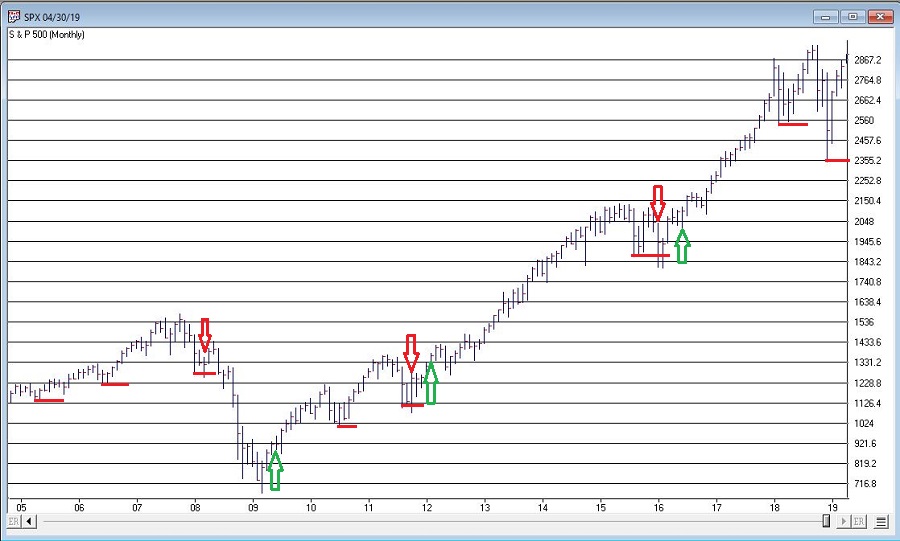
Figure 1 – One Minute a Month Trend-Following Alerts, Trigger prices and Signals (Courtesy AIQ TradingExpert)

Note that actual sell signals occurred in 2008, 2011 and 2015.  The signal in 2008 was a life-saver, while the signals in 2011 and 2015 resulted in small whipsaws.  Sorry folks, that’s just the nature of the beast.

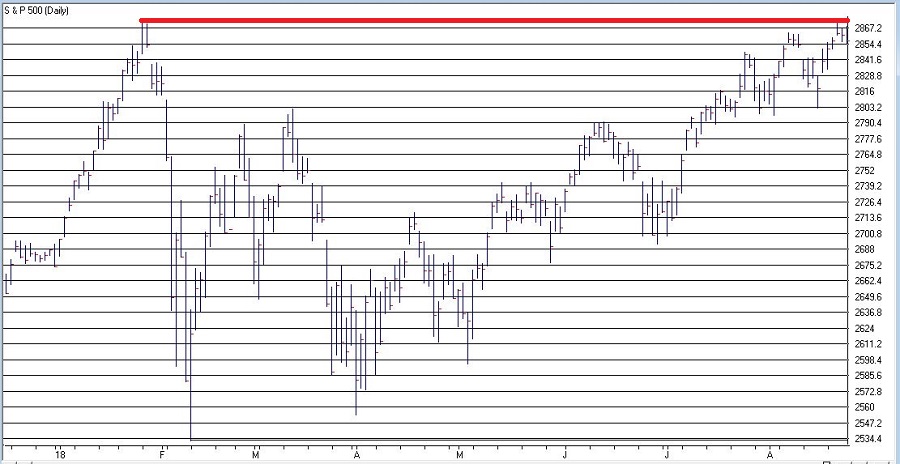
Interestingly, there have been two “Sell alerts” in the last year.  The first occurred at the end of April 2018, however, that alert was invalidated at the end of August 2018 when the S&P 500 pierced the previous 6-month high.  Another alert occurred at the end of December 2018.  The “Trigger price” is the December 2018 low of 2346.58.  That trigger is still active but could be invalidated if the month of May 2019 makes a high above whatever the high for April 2019 turns out to be.

The key point here is that despite the volatility and painful sell-offs in October and December of 2018, the “system” has remained on a buy signal.

Where to from here?  We’ll just have to wait and see.

Jay Kaeppel

Disclaimer:  The data presented herein were obtained from various third-party sources.  While I believe the data to be reliable, no representation is made as to, and no responsibility, warranty or liability is accepted for the accuracy or completeness of such information.  The information, opinions and ideas expressed herein are for informational and educational purposes only and do not constitute and should not be construed as investment advice, an advertisement or offering of investment advisory services, or an offer to sell or a solicitation to buy any security.

An Obscure But Useful Trend-Following Tool

Everyone has heard about trend-following.  And most traders have at least a foggy grasp of the relative pros and cons associated with trend following.  And anyone who has ever employed any type of trend-following technique is aware that they are great when there is an actual trend, but that whipsaws are inevitable.

What I am about to show you will not change these facts.  But today’s piece is just a “quickie” to highlight an obscure way to use a common indicator as a “confirmation/ denial” check when assessing the trend of a given security.  For the record, I am making no claim that this indicator generates profitably “trading signals in and of itself.  Its one of those things that – and I hate this phrase as much as you do but – should be used in conjunction with other indicators to get a good sense of the current “state of the trend” for a given security.

Nothing more, nothing less.

MACD Stretched Long

Most traders are familiar with the MACD indicator.  Originally popularized by Gerald Appel, it uses a set of moving averages to attempt to assess the trend in price (and many traders also use it to try to identify overbought or oversold situations).  Standard parameters are 9,26 and 12.  The version I use is different in several ways:

*Whereas the standard MACD generates two lines and a histogram can be drawn of the difference between the two, this version just generates one line – we will call in the trend line (catchy, no?)

*We will use parameters of 40 and 105

*One other note is that (at least according to me) this indicator is best used with weekly data.

The MACD4010501

Here is the formula for AIQ TradingExpert Expert Design Studio:

Define ss3 40.

Define L3 105.

ShortMACDMA3 is expavg([Close],ss3)*100.

LongMACDMA3 is expavg([Close],L3)*100.

MACD4010501Value is ShortMACDMA3-LongMACDMA3.

As I said this should be used with “other” indicators.  For example, one might consider the current price versus a 40-week moving average.

Standard Interpretation:

*If price is above the 40-week moving average (or if whatever other trend-following indicator you are using is bullish), AND

*The MACD4010501 is trend higher THEN

ONLY play the long side of that security

Likewise:

*If price is below the 40-week moving average (or if whatever other trend-following indicator you are using is bearish), AND

*The MACD4010501 is trend lower THEN

ONLY play the short side of that security (or at least DO NOT play the long side)

Finally, DO NOT assume that every change of trend in MACD4010501 is some sort of buy or sell signal.  Consider it only as a filter for your trades.

Some random examples appear in Figures 1 through 4 (click to enlarge any chart)

1

Figure 1 – AMZN (Courtesy AIQ TradingExpert)

2

Figure 2 – IBM (Courtesy AIQ TradingExpert)

3

Figure 3 – WMT (Courtesy AIQ TradingExpert)

4

Figure 4 – TLT (Courtesy AIQ TradingExpert)

Summary

To repeat, the proper use of this obscure version of the popular MACD indicator is as follows:

*Consider the trend of MACD4010501

*Consider one or more other trend-following indicators

*If there is bullish agreement, then apply your own shorter-term entry and exit techniques to trade the long side.

*If there is bearish agreement, then apply your own shorter-term entry and exit techniques to trade the short side (or simply stand aside).

Trade on!

Jay Kaeppel

Disclaimer:  The data presented herein were obtained from various third-party sources.  While I believe the data to be reliable, no representation is made as to, and no responsibility, warranty or liability is accepted for the accuracy or completeness of such information.  The information, opinions and ideas expressed herein are for informational and educational purposes only and do not constitute and should not be construed as investment advice, an advertisement or offering of investment advisory services, or an offer to sell or a solicitation to buy any security.

New Highs, Check…Now What?

Let’s open with Jay’s Trading Maxim #7.

Jay’s Trading Maxim #7: Being able to identify the trend today is worth more than 1,000 predictions of what the trend will be in the future.

Yes trend-following is boring.  And no, trend-following never does get you in near the bottom nor out at the top.  But the reality is that if you remain long when the trend appears to be up (for our purposes here let’s define this roughly as the majority of major market averages holding above their long-term moving averages) and play defense (i.e., raise cash, hedge, etc.) when the trend appears to be down (i.e., the majority of major market averages are below their long-term moving averages), chances are you will do pretty well for yourself.  And you may find yourself sleeping pretty well at night as well along the way.

To put it more succinctly:

*THE FOREST = Long-term trend

*THE TREES = All the crap that everyone tells you “may” affect the long-term trend at some point in the future

Human nature is a tricky thing.  While we should clearly be focused on THE FOREST the reality is that most investors focus that majority of their attention on all those pesky trees.  Part of the reason for this is that some trees can offer clues.  It’s a question of identifying a few “key trees” and then ignoring the rest of the noise.

A New High

With the Dow Industrials rallying to a new high virtually all the major averages have now reached a new high at least within the last month.  And as you can see in Figure 1 all are well above their respective 200-day moving average.  Long story short the trend is “UP”.

(click to enlarge)1Figure 1 – U.S. Major Market Indexes in Uptrends (Courtesy AIQ TradingExpert)

Now What? The Good News

As strong as the market has been of late it should be noted that we are about to enter the most favorable seasonal portion of the 48-month election cycle.  This period begins at the close of September 2018 and extends through the end of December 2019.

Figure 2 displays the growth of $1,000 invested in the Dow Industrials only during this 15-month period every 4 years.  Figure 3 displays the actual % +(-) for each of these periods.  Note that since 1934-35, the Dow has showed a gain 20 out of 21 times during this period.

2a

Figure 2 – Growth of $1,000 invested in Dow Industrials ONLY during 15 bullish months (mid-term through pre-election year) within 48-month election cycle.

Start Date End Date Dow % +(-)
9/30/1934 12/31/1935 +55.6%
9/30/1938 12/31/1939 +6.2%
9/30/1942 12/31/1943 +24.5%
9/30/1946 12/31/1947 +5.1%
9/30/1950 12/31/1951 +18.9%
9/30/1954 12/31/1955 +35.5%
9/30/1958 12/31/1959 +27.7%
9/30/1962 12/31/1963 +31.8%
9/30/1966 12/31/1967 +16.9%
9/30/1970 12/31/1971 +17.0%
9/30/1974 12/31/1975 +40.2%
9/30/1978 12/31/1979 (-3.1%)
9/30/1982 12/31/1983 +40.4%
9/30/1986 12/31/1987 +9.7%
9/30/1990 12/31/1991 +29.2%
9/30/1994 12/31/1995 +33.1%
9/30/1998 12/31/1999 +46.6%
9/30/2002 12/31/2003 +37.7%
9/30/2006 12/31/2007 +13.6%
9/30/2010 12/31/2011 +13.0%
9/30/2014 12/31/2015 +2.2%

Figure 3 – 15 bullish months (mid-term through pre-election year) within 48-month election cycle

Now What? The Worrisome Trees

While the major averages are setting records a lot of other “things” are not.  My own cluster of “market bellwethers” appear in Figure 4.  Among them the Dow Transportation Index is the only one remotely close to a new high, having broken out to the upside last week.  In the meantime, the semiconductors (ticker SMH), the inverse VIX index ETF (ticker ZIV) and Sotheby’s (ticker BID) continue to meander/flounder. This is by no means a “run for the hills” signal.  But the point is that at some point I would like to see some confirmation from these tickers that often (though obviously not always) presage trouble in the stock market when they fail to confirm bullish action in the major averages.

(click to enlarge)4Figure 4 – Jay’s 4 Bellwethers (SMH/TRAN/ZIV/BID) (Courtesy AIQ TradingExpert)

Another source of potential concern is the action of, well, the rest of the darn World.  Figure 5 displays my own regional indexes – Americas, Europe, Asia/Pacific and Middle East.  They all look awful.

(click to enlarge)3Figure 5 – 4 World Regional Indexes (Courtesy AIQ TradingExpert)

Now the big question is “will the rest of the world’s stock markets start acting better, or will the U.S. market start acting worse?”  Sadly, I can’t answer that question.  The key point I do want to make though is that this dichotomy of performance – i.e., U.S market soaring, rest of the world sinking – is unlikely to be sustainable for very long.

Summary

It is hard to envision the market relentlessly higher with no serious corrections over the next 15 months.  And “yes”, those bellwether and world region indexes trees are “troublesome”.

Still the trend at the moment is inarguably “Up” and we about to enter one of the most seasonally favorable periods for the stock market.

So, my advice is simple:

1) Decide now what defensive actions you will take if the market does start to breakdown

2) Resolve to actually take those actions if the need arises

3) Enjoy the ride as long as it lasts.

Jay Kaeppel

Disclaimer:  The data presented herein were obtained from various third-party sources.  While I believe the data to be reliable, no representation is made as to, and no responsibility, warranty or liability is accepted for the accuracy or completeness of such information.  The information, opinions and ideas expressed herein are for informational and educational purposes only and do not constitute and should not be construed as investment advice, an advertisement or offering of investment advisory services, or an offer to sell or a solicitation to buy any security.

The SPX ‘Magic Number’

According to one simple technique the “Magic Number” for the S&P 500 Index is 2872.87.  According to this simple technique if the S&P 550 Index closes above this number the stock market “should” continue to be bullish for at least another year.

Sounds optimistic? Well, there certainly are no “sure things” in the financial markets.  Still, let’s take a closer look.

The Simple Technique

The technique I mentioned works like this:

When the S&P 500 Index:

*Closes at its highest price in the past 252 trading days

*For the 1st time in the most recent 126 trading days

*It generates a bullish signal for the next 252 trading days

In essence, we are talking about buying when the index makes a 1-year high for the 1st time in 6 months and holding for 1 year.

Figure 1 displays the most recent previous buy signal that occurred on 7/11/16.  The sell date was 252 trading days later on 7/11/17.

1

Figure 1 – 2016 Signal (Courtesy AIQ TradingExpert)

Figure 2 displays the signal before that which occurred on 2/27/12.  The sell date was 252 trading days later on 2/26/13.

2

Figure 2 – 2012 Signal (Courtesy AIQ TradingExpert)

Figure 3 displays all the signals since 1933.

Buy Date Sell Date Buy Price Sell Price %+(-)
5/27/33 4/6/34 9.64 10.95 +13.6
5/18/35 3/20/36 9.87 15.04 +52.4
10/6/38 8/9/39 12.82 11.78 (8.1)
10/7/42 8/10/43 9.17 11.71 +27.7
6/1/44 4/7/45 12.31 13.84 +12.4
5/15/48 4/8/49 16.55 14.97 (9.5)
10/5/49 8/23/50 15.78 18.82 +19.3
3/5/54 3/4/55 26.52 37.52 +41.5
8/4/58 8/4/59 47.94 60.61 +26.4
1/10/61 11/2/62 58.97 57.75 (2.1)
4/15/63 4/15/64 69.09 80.09 +15.9
4/24/67 4/25/68 92.62 96.62 +4.3
4/30/68 6/9/69 97.46 101.2 +3.8
1/8/71 1/6/72 92.19 103.51 +12.3
2/7/72 2/8/73 104.54 113.16 +8.2
6/24/75 6/22/76 94.19 103.47 +9.9
8/1/78 7/31/79 100.66 103.81 +3.1
8/14/79 8/12/80 107.52 123.79 +15.1
10/8/82 10/6/83 131.05 170.28 +29.9
11/7/84 11/7/85 169.17 192.62 +13.9
10/19/88 10/18/89 276.97 341.76 +23.4
5/30/90 2/13/92 360.86 413.69 +14.6
7/30/92 7/29/93 423.92 450.24 +6.2
2/6/95 2/5/96 481.14 641.43 +33.3
9/3/03 9/2/04 1026.27 1118.31 +9.0
11/5/04 11/4/05 1166.17 1220.14 +4.6
10/13/09 10/13/10 1073.19 1178.1 +9.8
11/5/10 11/4/11 1225.85 1253.23 +2.2
2/27/12 2/26/13 1367.59 1496.94 +9.5
7/11/16 7/11/17 2137.16 2425.53 +13.5

Figure 3 – Previous Signals

Things to note:

*27 of the 30 signals (i.e., 90%) have witnessed a 12-month gain

*3 of 30 signals (i.e., 10%) have witnessed a loss

*The last “losing trade” occurred in 1961-1962

*The last 20 signals have been followed by a 12-month gain for the S&P 500

*The average of all 30 signals is +13.9%

*The average for all 27 winning trades is +16.1%

*The average of all 3 losing trades is -6.6%

*The worst losing trade was -9.5%

Two Technical Notes

Believe it or not, into the early 1950’s the stock market used to be open on Saturday.  So those days counted toward the 126 and 252 trading days counts.  This explains why the buy and sell dates prior to 1954 were less than one calendar year apart.

It is possible to get a new signal before an existing signal reaches it’s Sell Date.  In those rare cases we simply extend the holding period an additional 252 trading days.  This occurred in 1961-1962, 1968-1969, 1990-1992.

Figure 4 shows that SPX is very close to generating a new signal.  The most recent high close was in January at 2872.87 which was more than 126 trading days ago.  A new signal will occur if SPX closes above that level.

4

Figure 4 – Potential new signal forming (Courtesy AIQ TradingExpert)

Summary

The Good News is that this technique has a 90% accuracy rate and that one good day in the market could generated a new buy signal.  The Bad News is that – as I mentioned earlier – there are no “sure things” in the market.  Given that this particular method is on a 20-trade winning streak, it is understandable to think that maybe the law of averages is against it this time.

We’ll just have to wait and see what happens.

Jay Kaeppel

Disclaimer:  The data presented herein were obtained from various third-party sources.  While I believe the data to be reliable, no representation is made as to, and no responsibility, warranty or liability is accepted for the accuracy or completeness of such information.  The information, opinions and ideas expressed herein are for informational and educational purposes only and do not constitute and should not be construed as investment advice, an advertisement or offering of investment advisory services, or an offer to sell or a solicitation to buy any security.

A Focus on the Trends in Stocks, Bonds and Gold

In the end it is not so much about “predicting” what will happen next in the financial markets, but rather recognizing – and being prepared for – the potential risks, that makes the most difference in the long run.  So let’s start by looking at current trends.
Stocks
Let’s start with a most simple trend-following model that works like this:
-A sell signal occurs when the S&P 500 Index (SPX) registers two consecutive monthly closes below its 21-month moving average
-After a sell signal, a buy signal occurs when SPX register a single monthly close above its 10-month moving average.
Figure 1 displays recent activity.
1
Figure 1 – SPX Trend-Following signals (Courtesy AIQ TradingExpert)
The good news is that this model does a good job of being out of stocks during long bear markets (1973-74, 2000-2002, 2008-2009).  The bad news is that – like any trend-following model – it gets “whipsawed” from time to time.  In fact the two most recent signals resulted in missing out on the October 2015 and March 2016 rallies.
But note the use of the phrase “simple trend-following model” and the lack of phrases such as “precision market timing” and “you can’t lose trading the stock market”, etc.
For now the trend is up.  A few things to keep an eye on appear in Figures 2 and 3.  Figure 2 displays four major averages.  Keep an eye to see if these averages break out to the upside (see here) or if they move sideways to lower.
2Figure 2 – Four Major Market Averages (Courtesy AIQ TradingExpert)
In addition, I suggest following the 4 tickers in Figure 3 for potential “early warnings” – i.e., if the major averages hit new highs that are not confirmed by the majority of the tickers in Figure 3.3
Figure 3 – Four potential “Early Warning” tickers  (Courtesy AIQ TradingExpert)
Bonds
My main “simple bond trend-following model” remains bearish.  As you can see in Figure 4, a buy signal for bonds occurs when the 5-week moving average for ticker EWJ (Japanese stocks) drops below its 30-week moving average and vice versa.
4
Figure 4 – Ticker EWJ 5-week and 30-week moving average versus ticker TLT (Courtesy AIQ TradingExpert)
A 2nd model using metals to trade bonds has been bullish of late but is close to dropping back into bearish territory.  Figure 5 displays the P/L from holding a long position of 1 t-bond futures contract ONLY when both the EWJ AND Metals models are bearish (red line) versus when EITHER model is bullish (blue line)
5
Figure 5 – T-bond futures $ gain/loss when EWJ OR Metals Models are Bullish (blue line) versus when EWJ AND Metals Models are both Bearish (red line); August 1990-present
Gold
My most basic gold trend-following model is still bearish.  This model uses my “Anti-Gold Index” (comprised of tickers GLL, SPX, UUP and YCS).  It is bullish for gold when a Front-Weighted Moving Average (detailed here) is below the 55-week exponential moving average and vice versa.
6
Figure 6 – Jay’s “Anti-Gold Index” versus ticker GLD (Courtesy AIQ TradingExpert)
Summary
So at the moment the stock model is bullish and the bond and gold models are bearish.  Are these trends certain to persist ad infinitum into the future?  Definitely not.  Will the models detailed here provide timely signals regarding when to get in or out the next time around?  Sorry, but it doesn’t always work that way with trend-following.
But as for me I prefer “riding the trend” to “predicting the future.”
Some painful lessons just stick with you I guess.
Jay Kaeppel  Chief Market Analyst at JayOnTheMarkets.com and AIQ TradingExpert Pro (http://www.aiqsystems.com) client. 
Disclaimer:  The data presented herein were obtained from various third-party sources.  While I believe the data to be reliable, no representation is made as to, and no responsibility, warranty or liability is accepted for the accuracy or completeness of such information.  The information, opinions and ideas expressed herein are for informational and educational purposes only and do not constitute and should not be construed as investment advice, an advertisement or offering of investment advisory services, or an offer to sell or a solicitation to buy any security.