According to one simple technique the “Magic Number” for the S&P 500 Index is 2872.87. According to this simple technique if the S&P 550 Index closes above this number the stock market “should” continue to be bullish for at least another year.
Sounds optimistic? Well, there certainly are no “sure things” in the financial markets. Still, let’s take a closer look.
The Simple Technique
The technique I mentioned works like this:
When the S&P 500 Index:
*Closes at its highest price in the past 252 trading days
*For the 1st time in the most recent 126 trading days
*It generates a bullish signal for the next 252 trading days
In essence, we are talking about buying when the index makes a 1-year high for the 1st time in 6 months and holding for 1 year.
Figure 1 displays the most recent previous buy signal that occurred on 7/11/16. The sell date was 252 trading days later on 7/11/17.
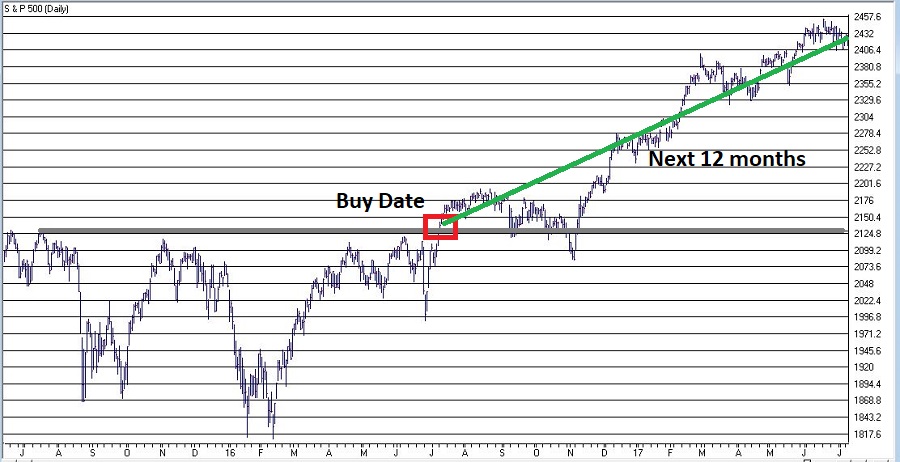
Figure 1 – 2016 Signal (Courtesy AIQ TradingExpert)
Figure 2 displays the signal before that which occurred on 2/27/12. The sell date was 252 trading days later on 2/26/13.
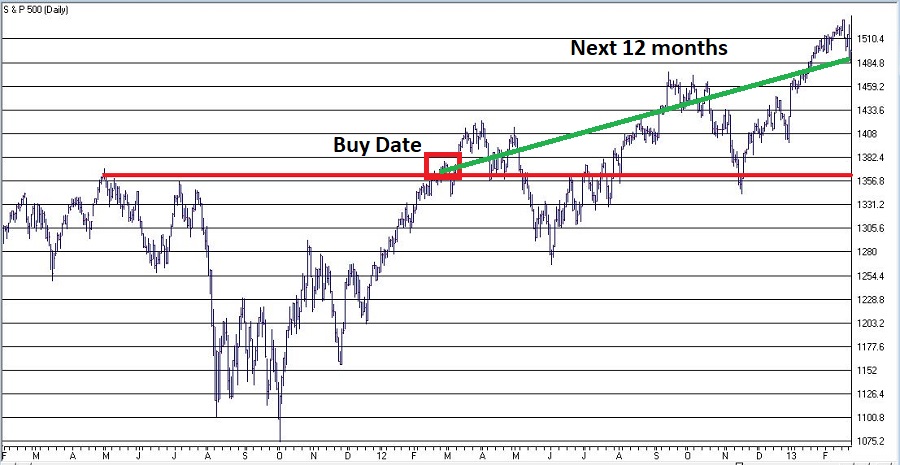
Figure 2 – 2012 Signal (Courtesy AIQ TradingExpert)
Figure 3 displays all the signals since 1933.
| Buy Date | Sell Date | Buy Price | Sell Price | %+(-) |
| 5/27/33 | 4/6/34 | 9.64 | 10.95 | +13.6 |
| 5/18/35 | 3/20/36 | 9.87 | 15.04 | +52.4 |
| 10/6/38 | 8/9/39 | 12.82 | 11.78 | (8.1) |
| 10/7/42 | 8/10/43 | 9.17 | 11.71 | +27.7 |
| 6/1/44 | 4/7/45 | 12.31 | 13.84 | +12.4 |
| 5/15/48 | 4/8/49 | 16.55 | 14.97 | (9.5) |
| 10/5/49 | 8/23/50 | 15.78 | 18.82 | +19.3 |
| 3/5/54 | 3/4/55 | 26.52 | 37.52 | +41.5 |
| 8/4/58 | 8/4/59 | 47.94 | 60.61 | +26.4 |
| 1/10/61 | 11/2/62 | 58.97 | 57.75 | (2.1) |
| 4/15/63 | 4/15/64 | 69.09 | 80.09 | +15.9 |
| 4/24/67 | 4/25/68 | 92.62 | 96.62 | +4.3 |
| 4/30/68 | 6/9/69 | 97.46 | 101.2 | +3.8 |
| 1/8/71 | 1/6/72 | 92.19 | 103.51 | +12.3 |
| 2/7/72 | 2/8/73 | 104.54 | 113.16 | +8.2 |
| 6/24/75 | 6/22/76 | 94.19 | 103.47 | +9.9 |
| 8/1/78 | 7/31/79 | 100.66 | 103.81 | +3.1 |
| 8/14/79 | 8/12/80 | 107.52 | 123.79 | +15.1 |
| 10/8/82 | 10/6/83 | 131.05 | 170.28 | +29.9 |
| 11/7/84 | 11/7/85 | 169.17 | 192.62 | +13.9 |
| 10/19/88 | 10/18/89 | 276.97 | 341.76 | +23.4 |
| 5/30/90 | 2/13/92 | 360.86 | 413.69 | +14.6 |
| 7/30/92 | 7/29/93 | 423.92 | 450.24 | +6.2 |
| 2/6/95 | 2/5/96 | 481.14 | 641.43 | +33.3 |
| 9/3/03 | 9/2/04 | 1026.27 | 1118.31 | +9.0 |
| 11/5/04 | 11/4/05 | 1166.17 | 1220.14 | +4.6 |
| 10/13/09 | 10/13/10 | 1073.19 | 1178.1 | +9.8 |
| 11/5/10 | 11/4/11 | 1225.85 | 1253.23 | +2.2 |
| 2/27/12 | 2/26/13 | 1367.59 | 1496.94 | +9.5 |
| 7/11/16 | 7/11/17 | 2137.16 | 2425.53 | +13.5 |
Figure 3 – Previous Signals
Things to note:
*27 of the 30 signals (i.e., 90%) have witnessed a 12-month gain
*3 of 30 signals (i.e., 10%) have witnessed a loss
*The last “losing trade” occurred in 1961-1962
*The last 20 signals have been followed by a 12-month gain for the S&P 500
*The average of all 30 signals is +13.9%
*The average for all 27 winning trades is +16.1%
*The average of all 3 losing trades is -6.6%
*The worst losing trade was -9.5%
Two Technical Notes
Believe it or not, into the early 1950’s the stock market used to be open on Saturday. So those days counted toward the 126 and 252 trading days counts. This explains why the buy and sell dates prior to 1954 were less than one calendar year apart.
It is possible to get a new signal before an existing signal reaches it’s Sell Date. In those rare cases we simply extend the holding period an additional 252 trading days. This occurred in 1961-1962, 1968-1969, 1990-1992.
Figure 4 shows that SPX is very close to generating a new signal. The most recent high close was in January at 2872.87 which was more than 126 trading days ago. A new signal will occur if SPX closes above that level.
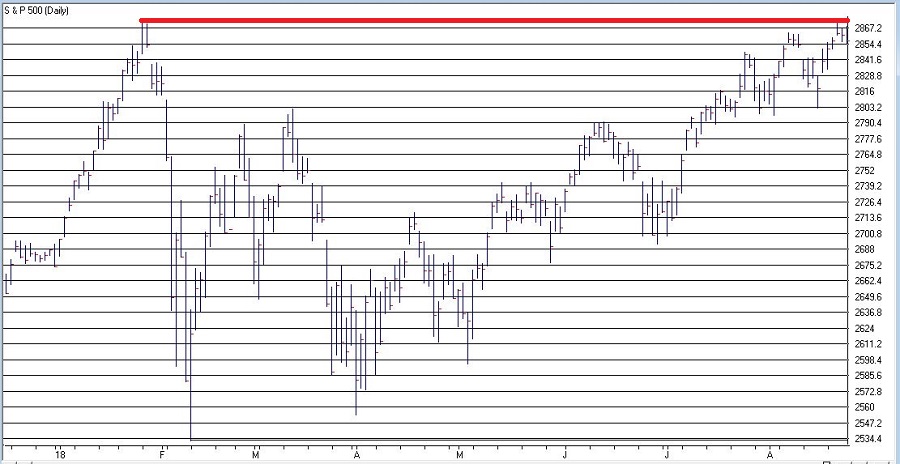
Figure 4 – Potential new signal forming (Courtesy AIQ TradingExpert)
Summary
The Good News is that this technique has a 90% accuracy rate and that one good day in the market could generated a new buy signal. The Bad News is that – as I mentioned earlier – there are no “sure things” in the market. Given that this particular method is on a 20-trade winning streak, it is understandable to think that maybe the law of averages is against it this time.
We’ll just have to wait and see what happens.
Jay Kaeppel
Disclaimer: The data presented herein were obtained from various third-party sources. While I believe the data to be reliable, no representation is made as to, and no responsibility, warranty or liability is accepted for the accuracy or completeness of such information. The information, opinions and ideas expressed herein are for informational and educational purposes only and do not constitute and should not be construed as investment advice, an advertisement or offering of investment advisory services, or an offer to sell or a solicitation to buy any security.