Category Archives: portfolio management

Focus on “Investing” (not “the Market”)

I don’t offer “investment advice” here at JOTM so I have not commented much on the recent action of the market lest someone thinks I am “predicting” what will happen next.  Like most people, predicting the future is not one of my strengths.  I do have some thoughts though (which my doctor says is a good thing).

The Big Picture

Instead of talking about “the markets”, let’s talk first about “investing”, since that is really the heart of the matter.  “The markets” are simply a means to an end (i.e., accumulating wealth) which is accomplished by “investing”.  So, let me just run this one past you and you can think about it for a moment and see if it makes sense.

Macro Suggestion

*30% invested on a buy-and-hold basis

*30% invested using trend-following methods

*30% invested using tactical strategies

*10% whatever

30% Buy-and-Hold: Avoid the mistake that I made way back when – of thinking that you should always be 100% in or 100% out of the market.  No one gets timing right all the time.  And being 100% on the wrong side is pretty awful.  Put some portion of money into the market and leave it there.  You know, for all those times the market goes up when you think it shouldn’t.

30% using trend-following methods:  Let me just put this thought out there – one of the biggest keys to achieving long-term investment success in the stock market is avoiding some portion of those grueling 30% to 89% (1929-1932) declines that rip your investment soul from you body and make you never want to invest again.  Adopt some sort of trend-following method (or methods) so that when it all hits the fan you have some portion of your money “not getting killed”.

30% invested using (several) tactical strategies: For some examples of tactical strategies see hereherehere and here.  Not recommending these per se, but they do serve as decent examples.

10% whatever:  Got a hankering to buy a speculative stock?  Go ahead.  Want to trade options?  OK.  Want to buy commodity ETFs or closed-end funds or day-trade QQQ?  No problem.  Just make sure you don’t devote more than 10% of your capital to your “wild side.”

When the market is soaring you will likely have at a minimum 60% to 90% of your capital invested in the market.  And when it all goes south you will have at least 30% and probably more out of the market ready to reinvest when the worm turns.

Think about it.

The Current State of Affairs  

What follows are strictly (highly conflicted) opinions.  Overall sentiment seems to me to be very bearish – typically a bullish contrarian sign.  However, a lot of people whose opinions I respect are among those that are bearish.  So, it is not so easy to just “go the other way.”  But here is how I see the current “conflict”.

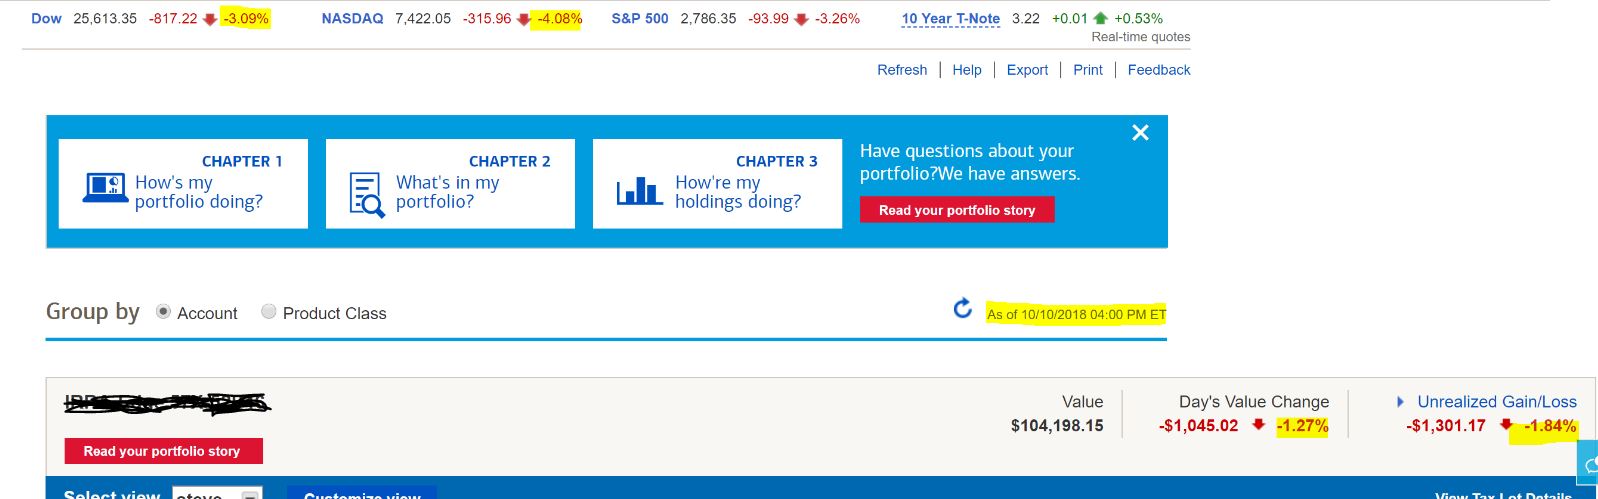
From a “technical” standpoint, things look awful.  Figures 1 and 2 show 4 major market averages and my 4 “bellwethers”.  They all look terrible.  Price breaking down below moving averages, moving average rolling over, and so on and so forth.  From a trend-following perspective this is bearish, so it makes sense to be “playing defense” with a portion of your capital as discussed above.

(click any Figure to enlarge)

1

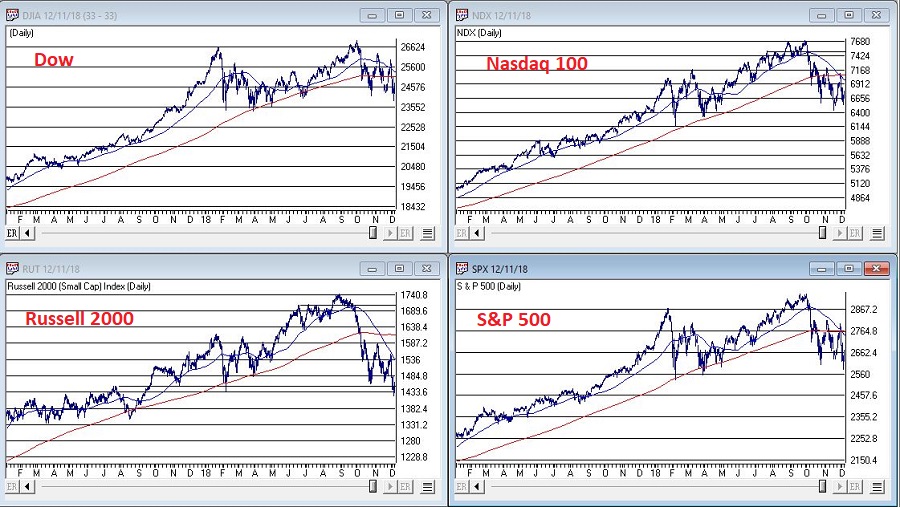
Figure 1 – Major market averages with 50-day and 200-day moving averages (Courtesy AIQ TradingExpert)

2

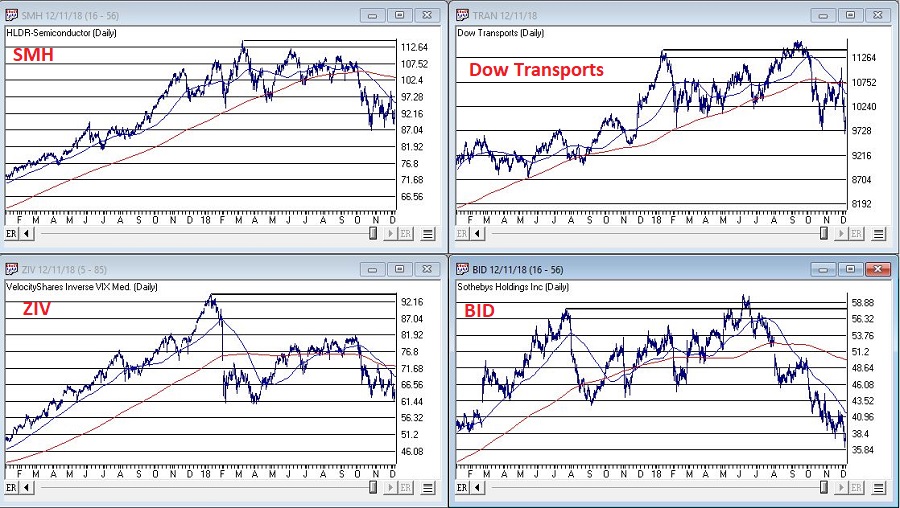
Figure 2 – Jay’s Market Bellwethers with 50-day and 200-day moving averages (Courtesy AIQ TradingExpert)

On the flip side, the market is getting extremely oversold by some measure and we are on the cusp of a pre-election year – which has been by far the best historical performing year within the election cycle.

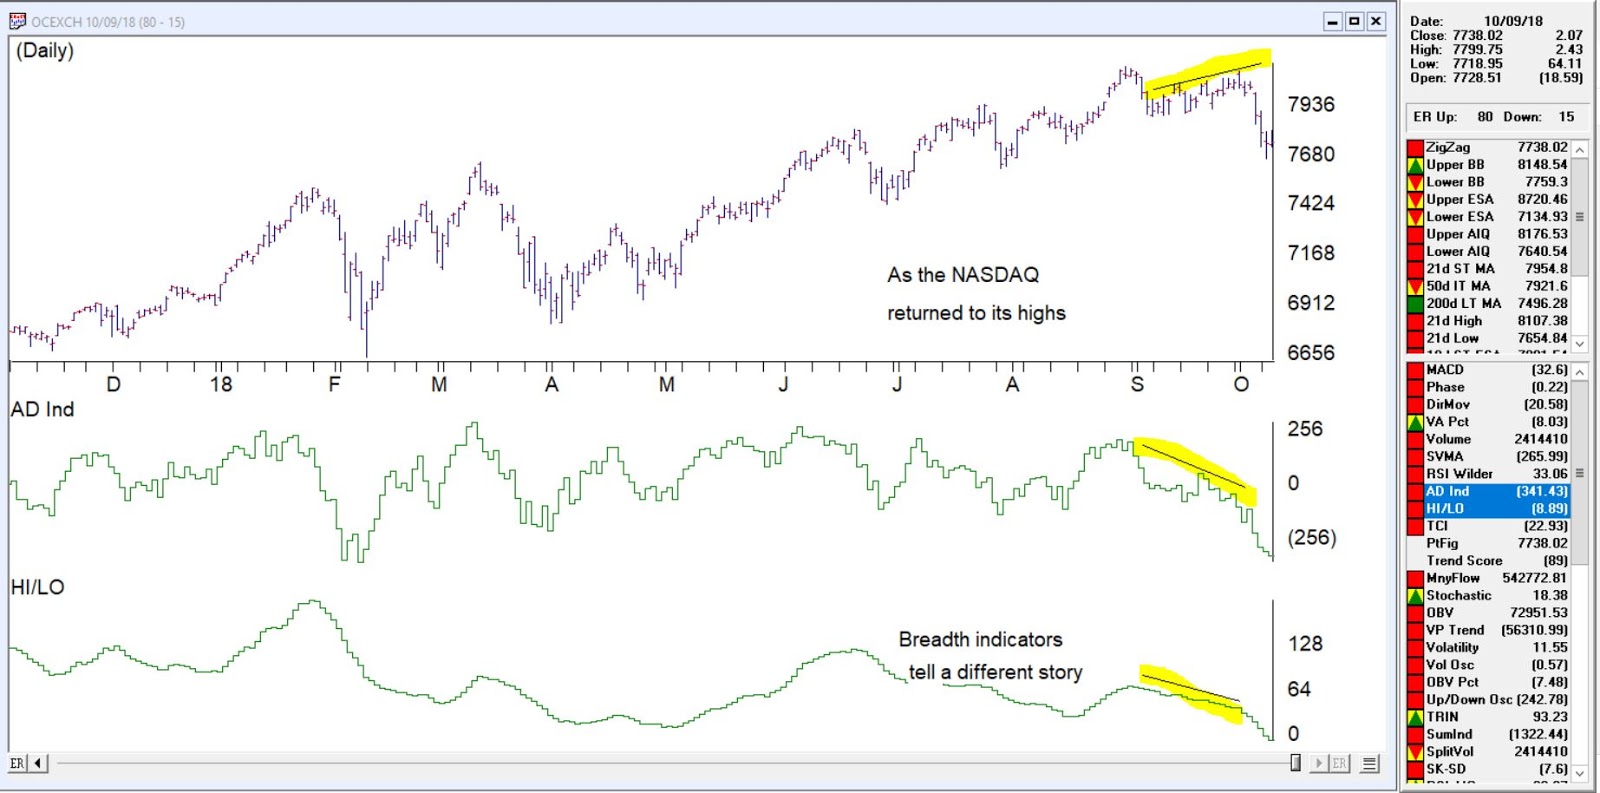
Figure 3 displays a post by the esteemed Walter Murphy regarding an old Marty Zweig indicator.  It looks at the 60-day average of the ratio of NYSE new highs to New Lows.  Low readings typically have marked good buying opportunities.

3

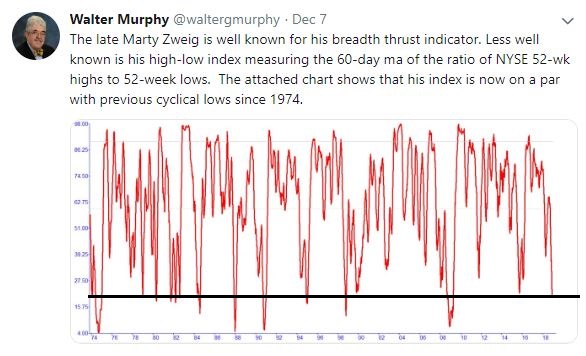
Figure 3 – Marty Zweig Oversold Indicator (Source: Walter Murphy on Twitter)

Figure 4 displays the growth of $1,000 invested in the S&P 500 Index ONLY during pre-election years starting in 1927.  Make no mistake, pre-election year gains are no “sure thing.”  But the long-term track record is pretty good.

4

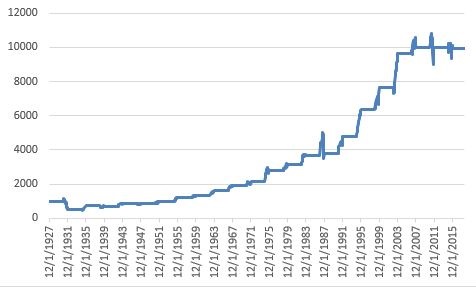
Figure 4 – Growth of $1,00 invested in S&P 500 Index ONLY during pre-election years (1927-present)

There is no guarantee that an oversold market won’t continue to decline.  And seasonal trends are not guaranteed to work “the next time.”  But when you get an oversold market heading into a favorable seasonal period, don’t close your eyes to the bullish potential.

Summary

Too many investors seem to think in absolute terms – i.e., I must be fully invested OR I must be out.  This is (in my opinion) a mistake.   It makes perfect sense to be playing some defense given the current price action.  But try not to buy into the “doomsday” scenarios you might read about.  And don’t be surprised (and remember to get back in) if the market surprises in 2019.

Jay Kaeppel

Disclaimer:  The data presented herein were obtained from various third-party sources.  While I believe the data to be reliable, no representation is made as to, and no responsibility, warranty or liability is accepted for the accuracy or completeness of such information.  The information, opinions and ideas expressed herein are for informational and educational purposes only and do not constitute and should not be construed as investment advice, an advertisement or offering of investment advisory services,

NASDAQ dive

Working on some slides for a seminar last week, it was apparent that breadth indicators on the NASDAQ signaled a divergence from the price action of the market.
Looking specifically at AD Ind and HI/LO, although other breadth measures told the same tale.

The AD indicator explained

The Advance/Decline Indicator is an exponentially weighted average of the net advancing versus declining issues. With this indicator, the direction of the trend is of importance and not the actual value of the indicator. When the indicator is increasing, advances are outweighing declines, and when it is decreasing, there are more declining is­sues than advancing.
The  Advance/Decline Indicator is a breadth indicator very similar to the Advance/Decline Line.  However, this indicator tends to be more sensitive and at times will signal a move earlier than the Advance/Decline Line.
The breadth was telling us something was amiss from last week. Take a look at this chart of the NASDAQ clearly a divergence was in place before the downturn.
Today’s (10-10-18) 316 point drop in the NASDAQ a 4% drop and nearly 9% drop from the high is close to the 10% corrective point and some buyers may come in over the next few days and keep the decline in check or not.
The markets are down between 6 and 10% in 5 days. Keeping good stops is a must in your portfolio to protect you from the worst of this. Using trailing stops between 7 and 10 % on stocks that are moving and protective stops 5 to 7 % below initial investment for example can easily reduce your losses in these volatile markets.

Portfolio Strategy Based On Accumulation/Distribution

The AIQ code based on Domenico D’Errico’s article in the August issue of Stocks & Commodities magazine, “Portfolio Strategy Based On Accumulation/Distribution,” is shown below.

“Whether you are an individual trader or an asset manager, your main goal in reading a chart is to detect the intentions of major institutions, large operators, well-informed insiders, bankers and so on, so you can follow them. Here, we’ll build an automated stock portfolio strategy based on a cornerstone price analysis theory.”

!Portfolio Strategy Based on Accumulation/Distribution
!Author: Domenic D'Errico, TASC Aug 2018
!Coded by: Richard Denning 6/10/18
!www.TradersEdgeSystem.com
!Portfolio Strategy Based on Accumulation/Distribution
!Author: Domenic D'Errico, TASC Aug 2018
!Coded by: Richard Denning 6/10/18
!www.TradersEdgeSystem.com

!SET TO WEEKLY MODE IN PROPERTIES
!ALSO VIEW CHARTS IN WEEKLY MODE

!INPUTS:
rLen is 4.
consolFac is 75. ! in percent
adxTrigger is 30.
volRatio is 1.
volAvgLen is 4.
volDelay is 4.

!CODING ABREVIATIONS:
H is [high].
L is [low].
C is [close].
C1 is valresult(C,1).
H1 is valresult(H,1).
L1 is valresult(L,1).

!RANGE ACCUMULATION/DISTRIBUTION:
theRange is hival([high],rLen) - loval([low],rLen).
Consol if theRange < consolFac/100 * valresult(theRange,rLen).
rRatio is theRange/valresult(theRange,4)*100.

!AVERAGE TRUE RANGE ACCUMULATION/DISTRIBUTION:
avgLen is rLen * 2 - 1.	
TR  is Max(H-L,max(abs(C1-L),abs(C1-H))).
ATR  is expAvg(TR,avgLen).

ConsolATR if ATR < consolFac/100 * valresult(ATR,rLen). atrRatio is ATR / valresult(ATR,4)*100. !ADX ACCUMULATION/DISTRIBUTION: !ADX INDICATOR as defined by Wells Wilder rhigh is (H-H1). rlow is (L1-L). DMplus is iff(rhigh > 0 and rhigh > rlow, rhigh, 0).
DMminus is iff(rlow > 0 and rlow >= rhigh, rlow, 0).
AvgPlusDM is expAvg(DMplus,avgLen).
AvgMinusDM is expavg(DMminus,avgLen).           	
PlusDMI is (AvgPlusDM/ATR)*100.	
MinusDMI is AvgMinusDM/ATR*100.	
DIdiff is PlusDMI-MinusDMI. 		
Zero if PlusDMI = 0 and MinusDMI =0.
DIsum is PlusDMI+MinusDMI.
DX is iff(ZERO,100,abs(DIdiff)/DIsum*100).
ADX is ExpAvg(DX,avgLen).

ConsolADX if ADX < adxTrigger. !CODE FOR ACCUMULATIOIN/DISTRIBUTION RANGE BREAKOUT: consolOS is scanany(Consol,250) then offsettodate(month(),day(),year()). Top is highresult([high],rLen,^consolOS). Top0 is valresult(Top,^consolOS) then resetdate(). Bot is loval([low],rLen,^consolOS). AvgVol is simpleavg([volume],volAvgLen). Bot12 is valresult(Bot,12). BuyRngBO if [close] > Top
and ^consolOS <= 5 and ^consolOS >= 1
and Bot > Bot12
and valresult(AvgVol,volDelay)>volRatio*valresult(AvgVol,volAvgLen+volDelay).
EntryPrice is [close].

Sell if [close] < loval([low],rLen,1).
ExitPrice is [close].

Figure 9 shows the summary backtest results of the range accumulation breakout system using NASDAQ 100 stocks from December 2006 to June 2018. The exits differ from the author’s as follows: I used two of the built-in exits — a 20% stop-loss and a profit-protect of 40% of profits once profit reaches 10%.

Sample Chart

FIGURE 9: AIQ. Here are the summary results of a backtest using NASDAQ 100 stocks.

Figure 10 shows a color study on REGN. The yellow bars show where the range accumulation/distribution shows a consolidation.

Sample Chart

FIGURE 10: AIQ. This color study shows range consolidation (yellow bars).

—Richard Denning

info@TradersEdgeSystems.com

for AIQ Systems

Volume-Weighted Moving Average Breakouts

The AIQ code based on Ken Calhoun’s article in the February 2017 issue of Technical Analysis ofSTOCKS & COMMODITIES, “Volume-Weighted Moving Average Breakouts,” can be found at http://aiqsystems.com/Volume-Weighted-Moving-Average-Breakouts.EDS 
 
Please note that I tested the author’s system using the NASDAQ 100 list of stocks on daily bars rather than intraday bars from 12/31/2008 thru 2/10/2017. Figure 7 shows the resulting equity curve trading the author’s system with the cross-down exit. Figure 8 shows the ASA report for this test. The annualized return showed about a 17% return with a maximum drawdown of 19%.
Sample Chart

FIGURE 7: AIQ. Here are sample test results from the AIQ Portfolio Manager taking three signals per day and 10 concurrent positions maximum run on NASDAQ 100 stocks (daily bar data) over the period 12/31/08 to 2/10/07.
Sample Chart

FIGURE 8: AIQ. This shows the ASA report for the system, which shows the test metrics and settings.
The code and EDS file can be downloaded from http://aiqsystems.com/Volume-Weighted-Moving-Average-Breakouts.EDS , and is also shown below.
!Volume-Weighted Moving Average Breakouts
!Author: Ken Calhoun, TASC Apr 2017
!Coded by: Richard Denning 2/11/17
!www.TradersEdgeSystems.com

!INPUTS:
smaLen is 70.
vwmaLen is 50.

SMA is simpleavg([close],smaLen).
VWMA is sum([close]*[volume],vwmaLen)/sum([volume],vwmaLen).
HasData if hasdatafor(max(smaLen,vwmaLen)+10)>max(smaLen,vwmaLen).
Buy if SMA < VWMA and valrule(SMA > VWMA,1) and HasData.
Sell if SMA > VWMA.

rsVWMA is VWMA / valresult(VWMA,vwmaLen)-1.
rsSMA is SMA / valresult(SMA,smaLen)-1.
—Richard Denning
info@TradersEdgeSystems.com
for AIQ Systems