What is the AI in AIQ?
The AI in TradingExpert Pro is programmed with the knowledge and insight of many stock market professionals, and is capable of making market recommendations based on this knowledge and insight; recommendations are made on a scientific basis free of bias, emotion, or hidden motives.
The AI or expert systems are programmed with rules that combine sound principles of technical analysis with the knowledge and experience of market professionals. Technical analysis, as used by AIQ, is based on the logic that price is the result of supply and demand. An AIQ timing signal, therefore, reflects all available knowledge and opinions such as news of the day, earnings, product reports, and company forecasts.
Technical analysis recognizes price and volume movement as the voice of the market itself and hence the only data necessary to determine what the market is likely to do next.
The AIQ Expert System
As an expert system, TradingExpert Pro is comprised of two knowledge bases – one for market timing and a second for stock selection – and an inference engine. Knowledge, in the form of rules, is stored in the knowledge bases. The inference engine is the thinking component of an expert system.
Each of the two knowledge bases within TradingExpert Pro has its own unique rules. The rules operate on facts which are values of the technical indicators. The indicators are computed from daily price, volume, and breadth data.
The rules employed in ATQ TradingExpert Pro are derived from the knowledge of many experts of market action and market timing. The reliability of these rules is maximized by combining them into a higher level of Expert Rules. Market analysts have found that no single rule or indicator works all the time. In AIQ, the Expert Rules and technical indicators work together to generate upside and downside signals.
Different knowledge bases for different market cycles
Continuing research at AIQ has shown that a single knowledge base can be improved if it is split into several knowledge bases, one for each phase of the market cycle. This advancement has been incorporated in the market timing knowledge base. The crest, trough, up slope, and down slope are each addressed by a specific set of rules specialized and weighted for that specific phase of the market cycle.
Each market day, then, the system determines the strength and direction of the phase, or trend. If there is no trend, it is first determined if the cycle is at a crest prior to a downtrend, or in a trough before the next uptrend. A more specialized knowledge base is used for each of these conditions, increasing the overall market timing effectiveness.
The inference engine
The knowledge base fuels the second part of the AIQ expert system, the inference engine. The inference engine is the thinking component of an expert system, and mimics the way humans think.
To understand how the AIQ inference engine works, picture a decision tree. The procedure starts from the tree’s trunk, where the major rules are located. Each rule is represented as a node, or fork, where the tree splits into three branches-representing a yes, a no, or a maybe. If the expert system determines that the premise of a rule is true, then the rule is considered to have fired, giving one of those three answers.
As each rule is evaluated, the process moves on to the next node and subsequent branches and continues to move on through the tree. Each rule node has an assigned value. That value is added to a node total that is accumulated as the inference engine passes through the tree. When all the rules have been evaluated, the resulting node total is normalized and becomes an AIQ Expert Rating.
Finally
The Expert Ratings are based on a scale of 0 to l00. The higher the Expert Rating, the stronger the signal. An Expert Rating of 95 or higher is considered a strong signal, meaning that there is a strong possibility that the price trend is about to change direction.
Confirmation of Expert Ratings
Research has shown that a change in direction of the Phase indicator (changing up for up ER, changing down for down ER) at or close to the high Expert Rating date provides a higher degree of confidence in the rating. Phase is not part of the Expert System.
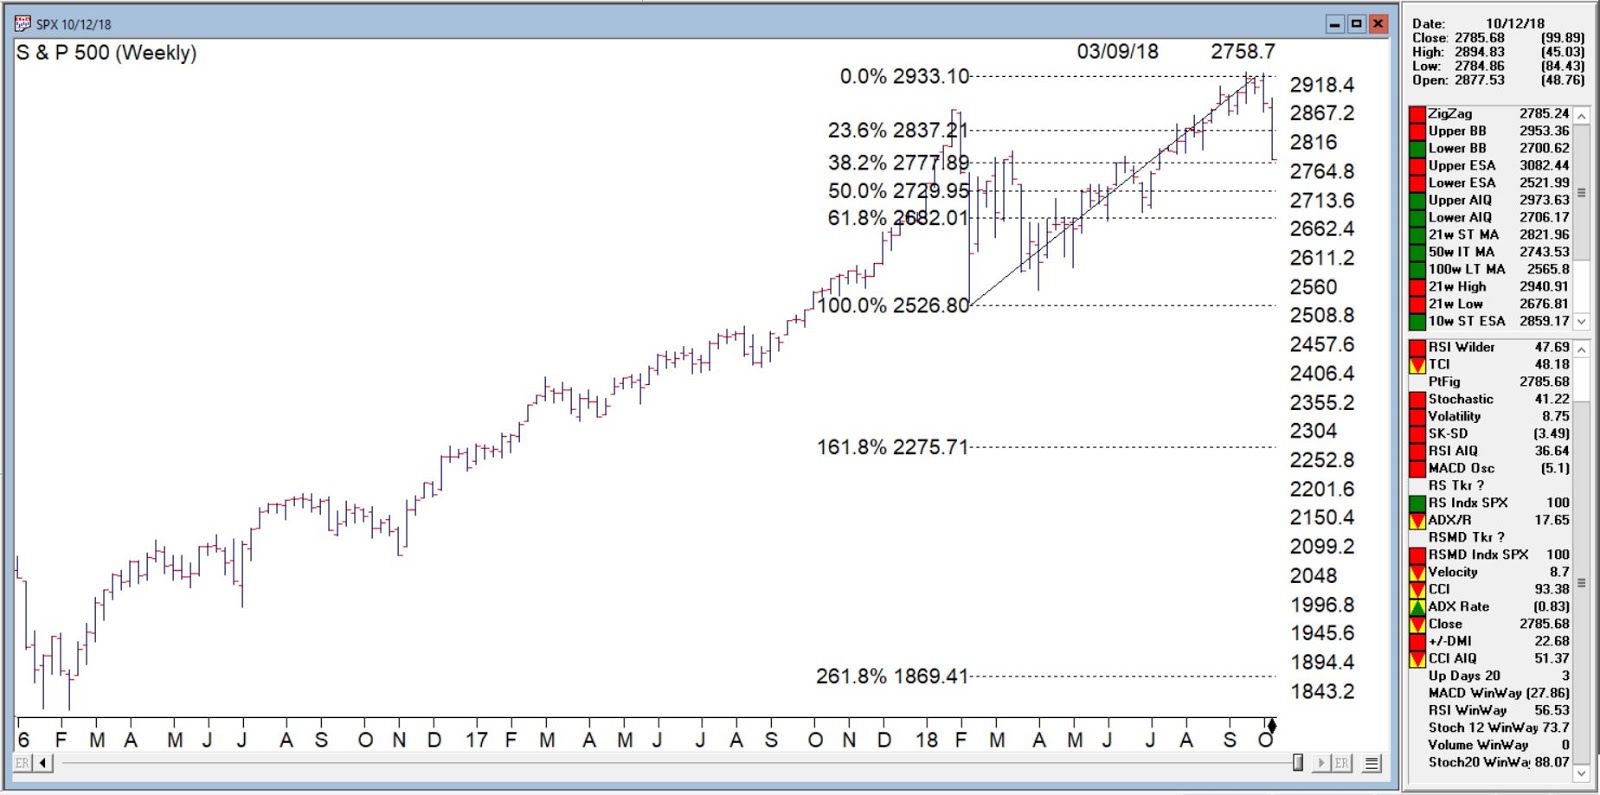
So let us examine the last 7 weeks market action.
2-98 down signal 9/18/2018, 9/18/18 and 9/20/18 all with these primary riles firing confirmed by phase
Intraday high prices of the market have increased to a 21 day high. Never the less, the advance/decline oscillator is negative. This unusual event is read as a very strong bearish signal that is often followed by an downward price movement.
Closing prices on the market have increased to a 21 day high but market breadth as measured by advances and declines is declining. This non-confirmation in a trading market is a weak bearish signal indicating a possible downward price movement.

DJIA with the 3 successive down signals
Confirmed down signal 4-96 on 10/05/18 these primary rules fires
Trend Status has changed to a strong down trend. This indicates that a downward trend has started that may continue in this direction. This is a moderate bearish signal.
The 21 day stochastic has declined below the 80% line and the price phase indicator is decreasing. In this strongly downtrending market this is an indication that the downtrend will continue.
Confirmed down signal 5-95 on 10/18/2018 these primary rules fires
The market closing average has dropped below the 21 day exponentially smoothed average price. At the same time, accumulation is decreasing. In this down trending market, this is taken as a very bearish signal that could be followed by further decreases in price.
The price phase indicator is positive but volume distribution has started to advance. This is a nonconformation that, regardless of the type of market, is a bearish signal which usually results in an downward movement of the market.
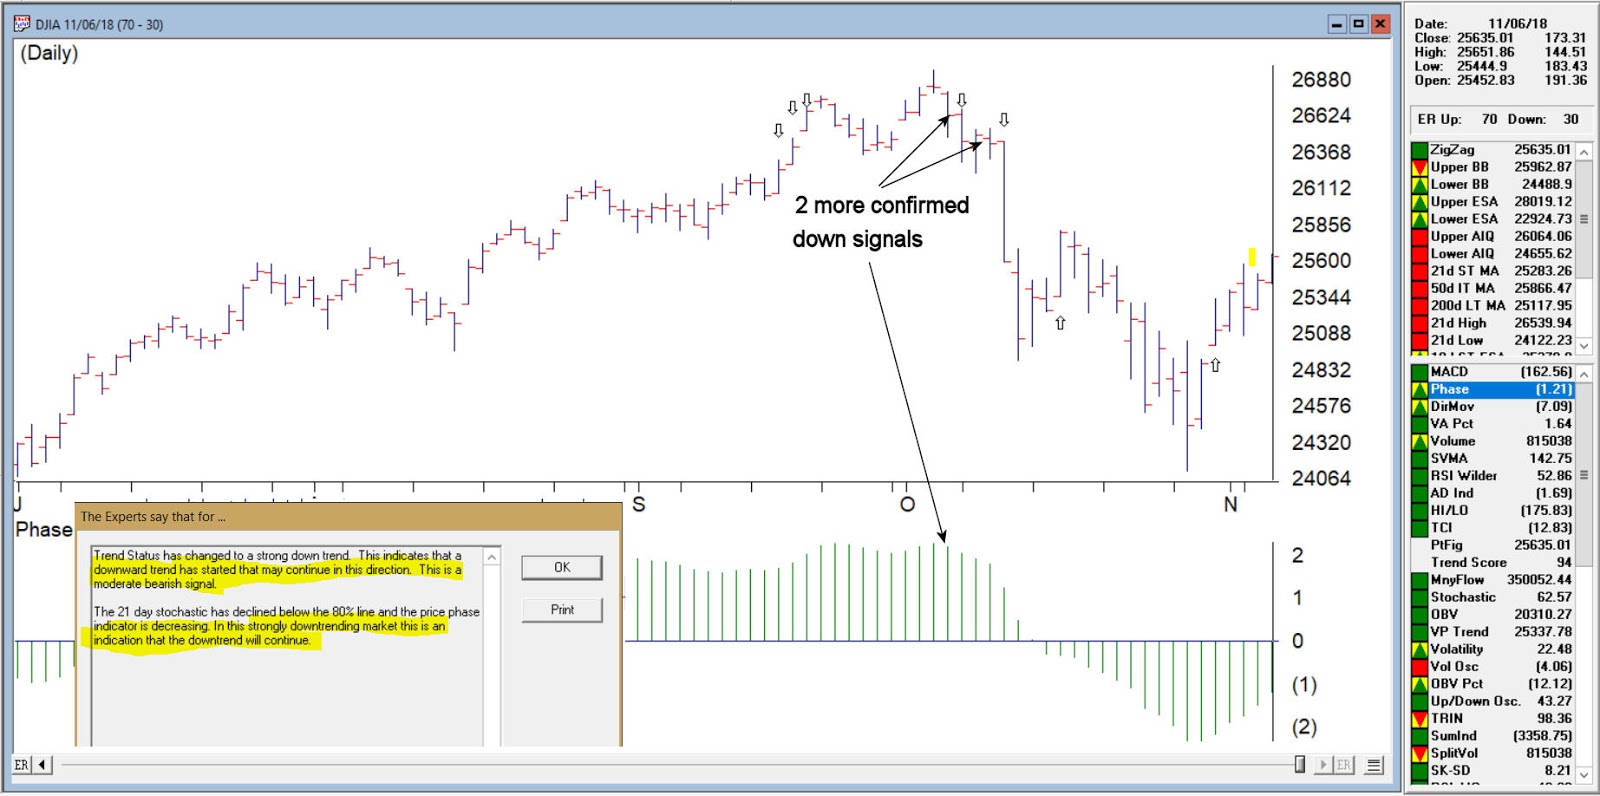
DJIA with 2 more down signals confirmed by phase
Unconfirmed up signal on 10/16/18 – phase did not change direction
Volume accumulation percentage is increasing and the 21 day stochastic has moved above the 20% line. In this downtrending market, this is taken as a strong bullish signal that could be followed by an upward price movement.
The price phase indicator is negative but volume accumulation has started to advance. This is a non-conformation that, regardless of the type of market, is a bullish signal which usually results in an upward movement of the market.
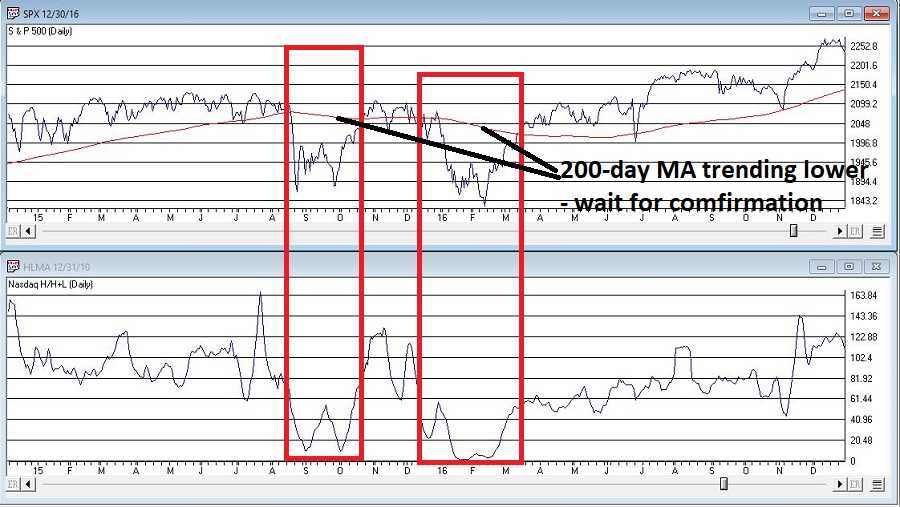
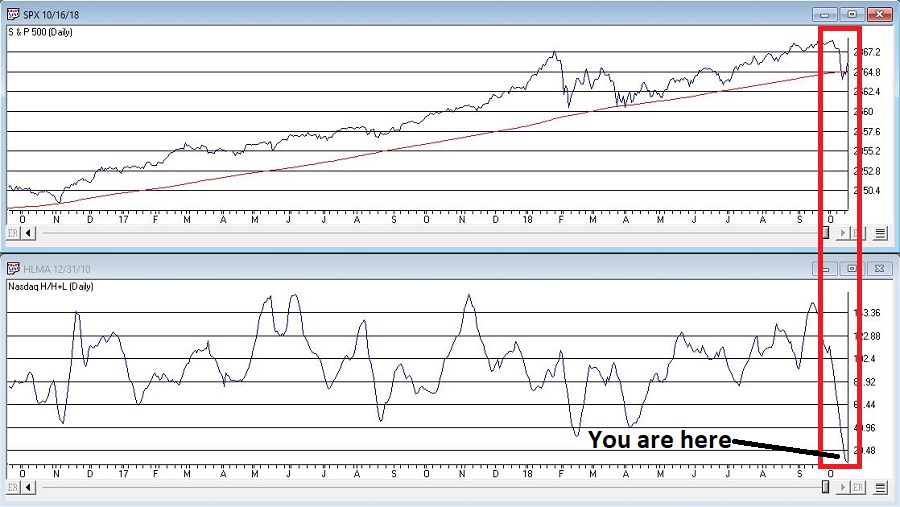
The new high/new low indicator has reversed to the upside. This is a reliable bullish signal that is often followed by an upward movement in prices. In this weak downtrending market an uptrend could start shortly.
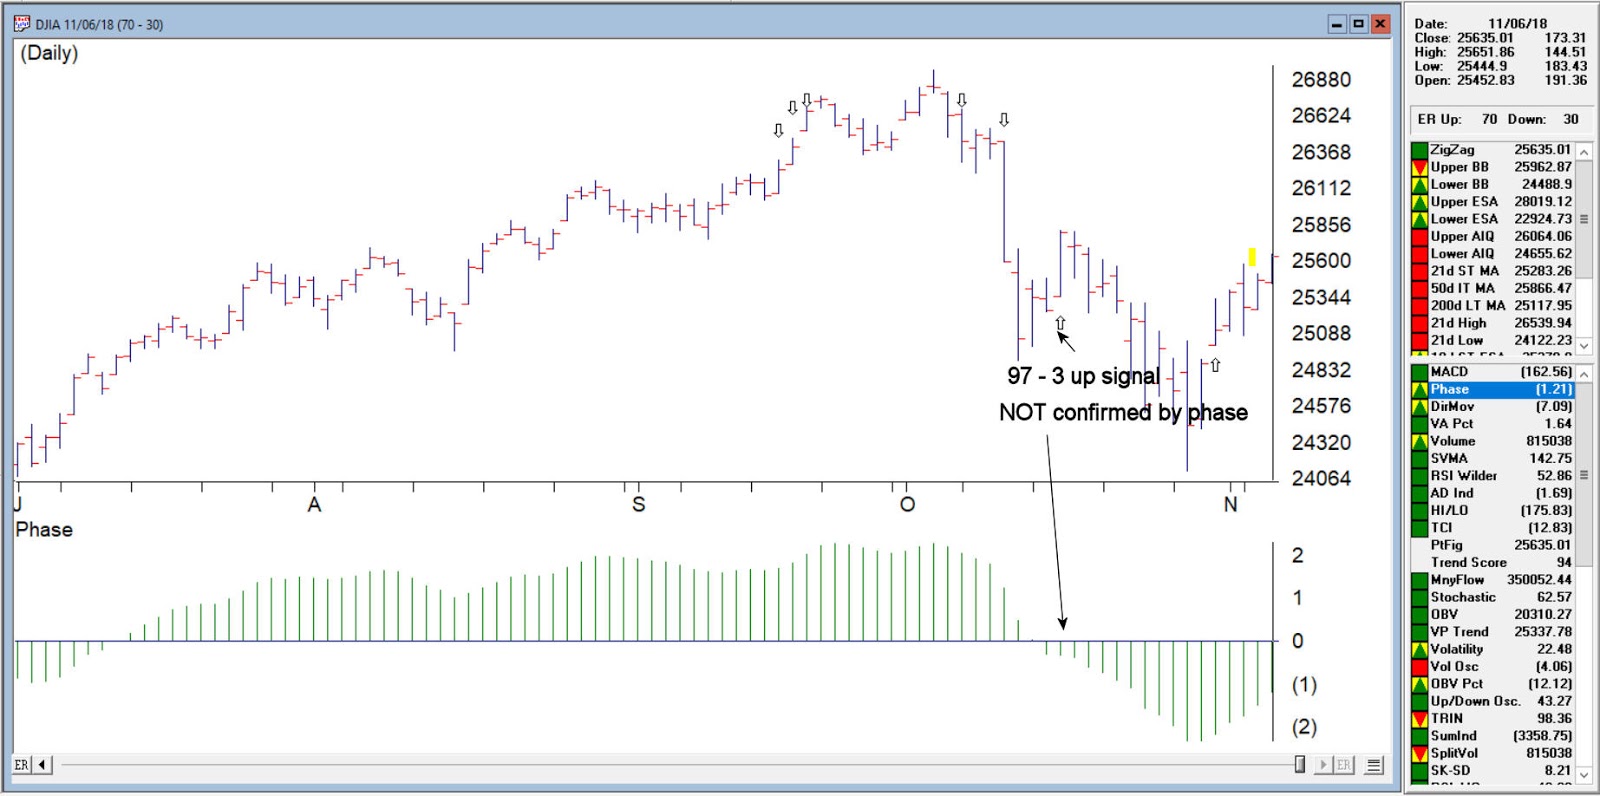
DJIA on 10/16/18 97-3 up no phase confirmation
Confirmed up signal 10/31/18 98-2
The 21 day stochastic has advanced and crossed the 20% line and the price phase indicator is also in- creasing. In this weakly downtrending market this is taken as a strong bullish signal suggesting an increase in prices.
Volume accumulation percentage is increasing and the 21 day stochastic has moved above the 20% line. In this downtrending market, this is taken as a strong bullish signal that could be followed by an upward price movement.
The new high/new low indicator has reversed to the upside. This is a reliable bullish signal that is often followed by an upward movement in prices. In this weak downtrending market an uptrend could start shortly.
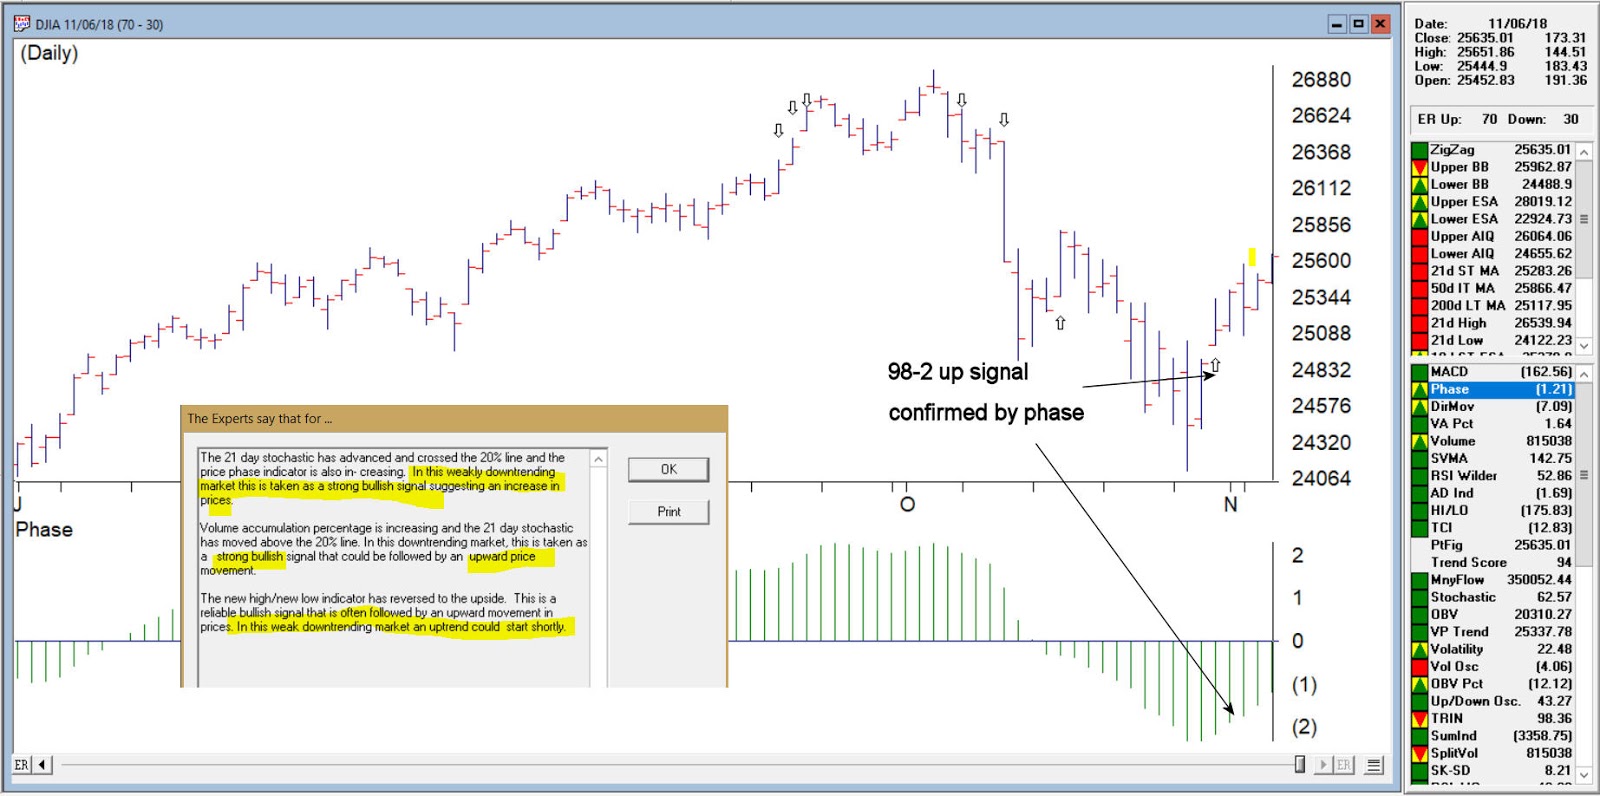
DJIA on 10/31/18 with confirmed up signal 98-2
While never perfect, the Expert rating provides a formidable advantage to the trader looking for signs of direction changes in the market. As of 11/7/18 close the DJIA was at 26180
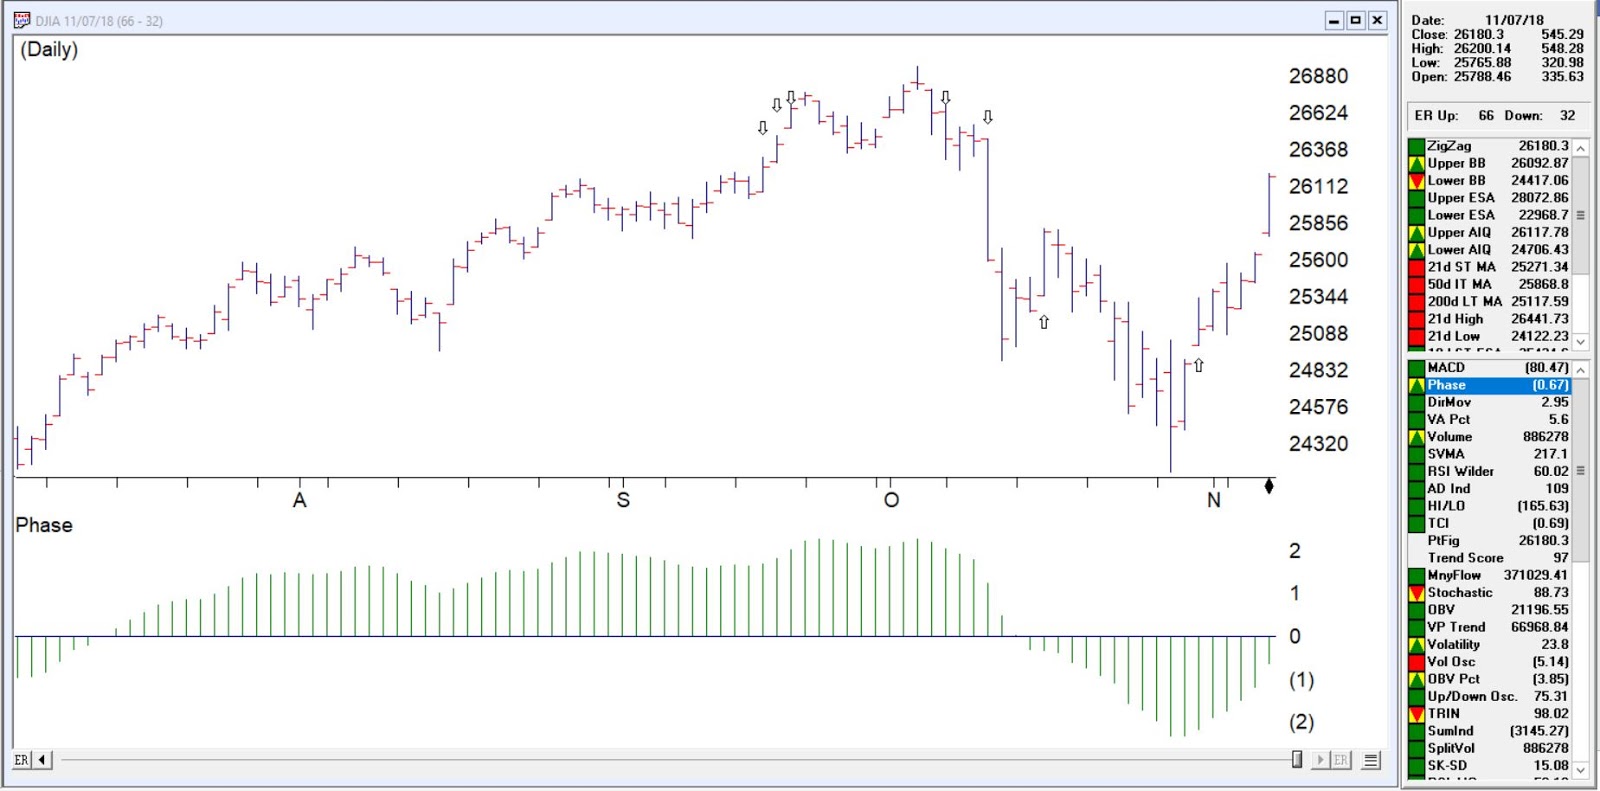
DJIA as of 11/7/18