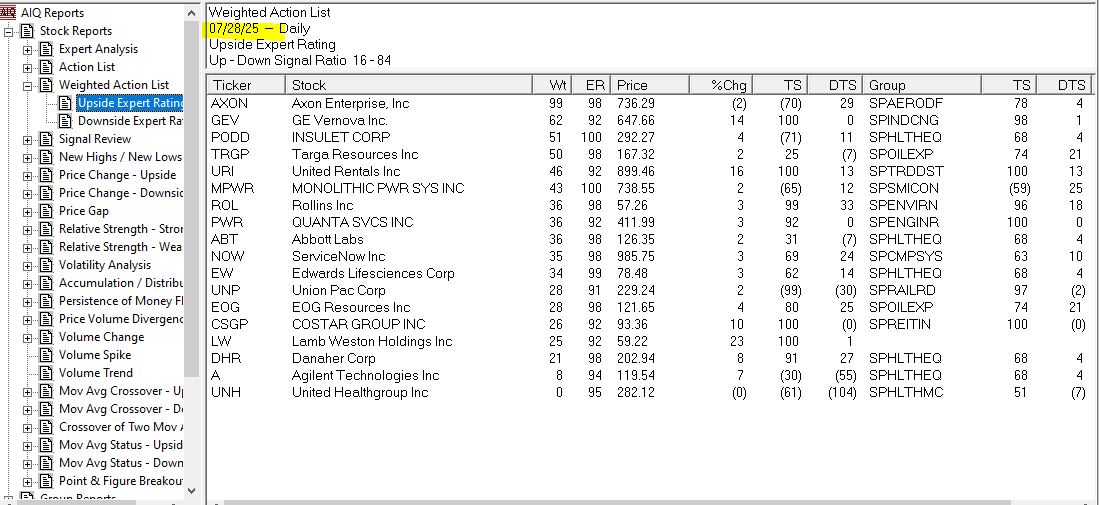
Serious traders are always on the hunt for tools that can give them an edge — something that cuts through the noise and reveals high-probability trade setups. That’s where TradingExpert Pro’s AI-based expert ratings come in. With over 400 built-in rule sets, this proprietary system assigns a bullish or bearish score to each stock, ranging from +100 (strong buy) to -100 (strong sell).
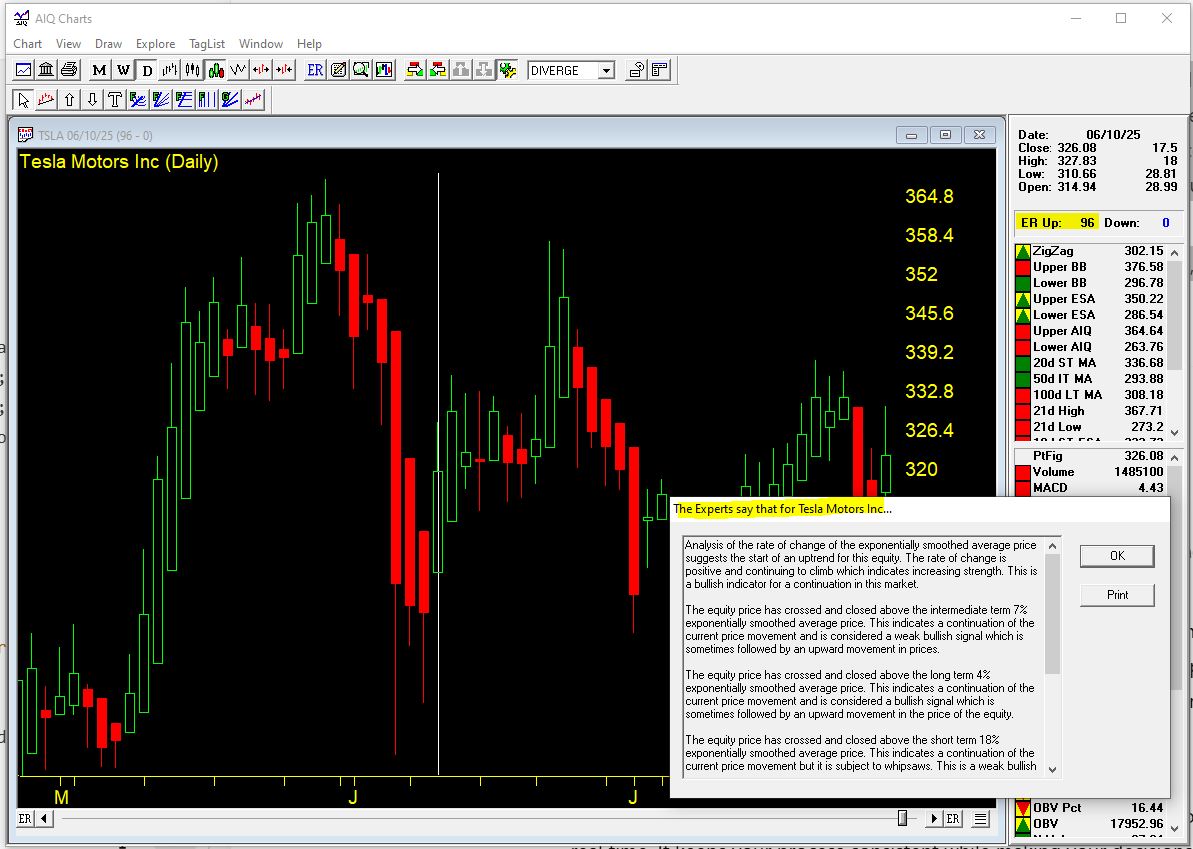
These scores are generated from technical rules developed by top traders and analysts, analyzing indicators like RSI, MACD, stochastic, volume, momentum, and dozens more. The AI scans every stock nightly, summarizing complex conditions into one clear rating. Traders use these scores to validate their setups, spot new opportunities, and avoid false breakouts.
In short, it’s a technical signal aggregator that saves time, reduces bias, and adds discipline — everything a serious trader wants.
AIQ Expert Rating signals are designed to anticipate changes in the direction of price movement. Some are accurate, while others are not. However, more often than not, the Expert Rating signals are accurate. Of the signals that are accurate, some are early, some are late, and some are timed perfectly. Since traders cannot predict next week’s market prices, they must decide whether to make a trade or to stand aside based on the information available.
In order to help the prudent trader increase the number of profitable trades, AIQ TradingExpert Pro provides a wide array of information that can be used for signal validation. The process of using other information to validate signals is called signal confirmation. Signal confirmation is accomplished in a variety of ways. Inherent in each method is a certain risk vs. reward characteristic; the specific method must be decided by each trader. As the level of confirmation increases, the level of risk is reduced. As risk is reduced, the level of potential reward is also reduced. Traders must balance their levels of risk tolerance against their reward objectives.
The Signal Confirmation rules are: 1. No Confirmation 2. Price Confirmation 3. Price/Volume Confirmation 4. Independent Corroboration by Separate TradingExpert Components Important