Hello Everyone,
I apologize for getting my newsletter out a week later than usual, my family had a needed short vacation.
Now for the good news, last month I stated that I was bullish on the markets and said I thought the markets would break out of the old 2886 level on the S&P and go to the 2954 level and possibly go to new highs. See last month’s Bartometer. The good news is the S&P is now at new highs and up another 6% since last month. The not so good news is that the small to midcap stocks are NOT at a new high and this divergence is showing me that we have a select narrow rally. The Small Cap index is 10% below its old top hit on 09/28/21018.
The Midcap Index is down 4.7% from last September as well. What does this mean? It means that there is a divergence in the stock market, and most of the participation is in the very large stocks like Microsoft, Netflix, etc. Even though this divergence is happening, my computer models are still somewhat bullish. Is it changing? You’ll see the answer in the chart below
Source: CNBC.com
Interest Outlook
As the major indexes reached all new highs, the Fed Chairman confirmed that the Fed would accept the lead from financial markets and cut their target interest rate by ¼%. Even though the Fed may reduce interest rates, there are many problems with Powell’s statements. His comments do not bode well for future moves. Especially if the economy goes into a recession over the next year or more. At this time long term rates should continue to be stabilized.
CURRENT EVENTS INFLUENCING MARKET MOVEMENT:
The Chinese tariff situation has calmed down somewhat allowing the markets to continue to rise as earnings from U.S. companies continue to grow. Overall the economy is doing relatively well. With a potential slowing of earnings ahead, the stock markets are now somewhat overbought. If interest rates stay at this very low level, then the stock market is still a decent value, but if interest rates start to head higher, the stock market ascent will then be over for a while. Overall, things look okay.
Index Averages
Some of the INDEXES of the markets both equities and interest rates are below. The source is Morningstar.com up until July 12, 2019. These are passive indexes.
*Dow Jones +18%
S&P 500 +21%
NASDAQ Aggressive growth +25%
I Shares Russell 2000 ETF (IWM) Small cap +17%
International Index (MSCI – EAFE ex USA) +11%
Moderate Mutual Fund +11%
Investment Grade Bonds (AAA) + 7% +2.64%
High Yield Merrill Lynch High Yield Index +9% +4.26%
Floating Rate Bond Index +5% +2.60%
Fixed Bond Yields (10 year) +2.% Yield 2.63%
The average Moderate Fund is up 11.6% this year fully invested as a 60% in
stocks and 40% in bonds. And nothing in the money market
*Explanation of each on the last page
The S&P 500
Source: AIQ Systems on graphs
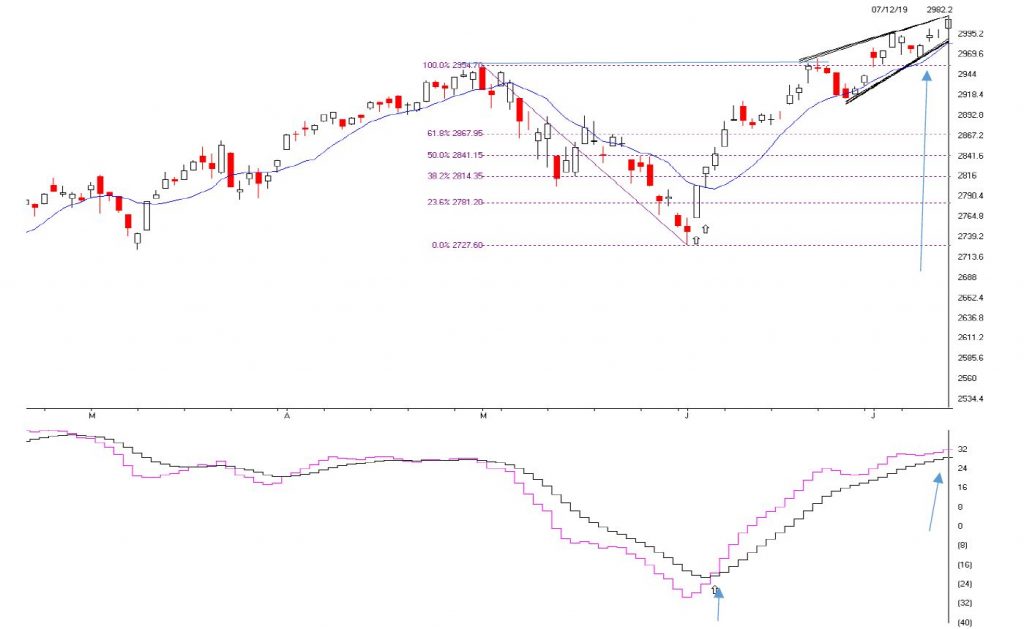
The S&P 500 has broken out to a new high last month on the Bartometer I was Bullish and stated that my computer models went to a Buy signal on June 4th at 2800 on the S&P 500. Now it is 3014. My computer models are still on the BUY-HOLD but the market is now getting very OVERBOUGHT and if I were in the market now I would start to take some money off the table and rebalance if you are in retirement.
The S&P 500 could go to 3130 to 3180 this year, but that would be a stretch and I don’t think the market has that much growth now for the rest of the year. Maybe 3-7% if that.
Notice the two trend-lines above at the top right of the top chart. There are two rising trend-lines, the blue arrow is pointing to it. This is call a RISING WEDGE. A Rising Wedge is a NEGATIVE pattern IF the trend-line is broken on the down side. This is a pattern that can be VOIDED if the S&P 500 closes above 3019 -3022 for 2-3 days with heavy volume. On the other hand, it the S&P 500 breaks below 2979, I will be getting Cautious. If it closes below 2979 then 2954 better hold or I will be getting VERY
CAUTIOUS. But remember if the market closes above 3019-3022 for 2 to 3 days with good volume then the pattern is voided.
This market is extended, so even though I am relatively still positive, I’ll let the market tell me what to do. So if the S&P Closes below 2979 I am getting Cautious, and a close below 2954 decisively, then I am getting Very Cautious. That means a trimming of your assets, or a partial sell and to transfer to more of a conservative account. Right now I am still BULLISH.
The second chart below is the MACD, a cross down could correspond with the breaking of 2954 DECISIVELY on a close. Notice in June it crossed above, see blue arrow, this was a great place to BUY. Now that it is much higher and with the extension of the market I gave you the information as to where the market could reverse and what to look for.
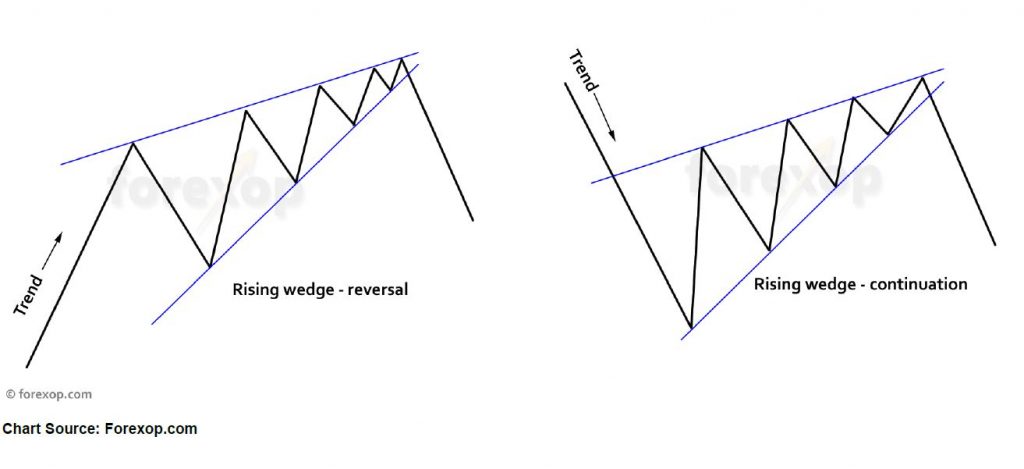
Chart Source: Forexop.com
The rising wedge pattern is characterized by a chart pattern which forms when the market makes higher highs and higher lows with a contracting range. When this pattern is found in an uptrend, it is considered a reversal pattern, as the contraction of the range indicates that the uptrend is losing strength.
When this pattern is found in a downtrend, it is considered a bearish pattern, as the market range becomes narrower into the correction, indicating that the correction is losing strength and that the resumption of the downtrend is in the making.
In a rising wedge, both boundary lines slant up from left to right. Although both lines point in the same direction, the lower line rises at a steeper angle than the upper one. Prices usually decline after breaking through the lower boundary line.
As far as volumes are concerned, they keep on declining with each new price advance or wave up, indicating that the demand is weakening at the higher price level. A rising wedge is more reliable when found in a bearish market. In a bullish trend what seems to be a Rising Wedge may be a Flag or a Pennant (stepbrother of a wedge) requiring about four weeks to complete.
Rising Wedges are not guaranteed, so the 3019-3022 level and staying there for a couple of days could void this negative pattern. A break decisively on a close below 2979 could satisfy the Rising Wedge.
Source: Wikipedia
*A Support or support level is the level at which buyers tend to purchase or into a stock or index. It refers to the stock share price that a company or index should hold and start to rise. When a price of the stock falls towards its support level, the support level holds and is confirmed, or the stock continues to decline, and the support level must change.
- Support levels on the S&P 500 area are 2986, 2954, 2910, and 2780 areas. These might be BUY areas.
- Support levels on the NASDAQ are 8175, 7884, 7771, and 7657.
- On the Dow Jones support is at 26918, 26708, 25,538 and 26318.
These may be safer areas to get into the equity markets on support levels slowly. RESISTANCE LEVEL ON THE S&P 500 IS 3019 but rising as market goes up. If there is a favorable tariff settlement, the market should rise short term.
Source: Investopedia
THE BOTTOM LINE:
The S&P 500 has reached a new high, and as long as 2954 does not break down decisively with a lot a volume I am still relatively positive. We are positively OVERBOUGHT here short, so THIS IS NOT A TIME TO BUY a lot of Indexes here in my opinion I am still relatively Bullish.
The S&P needs to close above 3019-3022 and stay there two days to form another base from which to rise more, but if the S&P breaks below 2979, and daily this trend-line is rising, I will be getting Cautious, and a convincing close below 2954 will get me Very Cautious.
Best to all of you,
Joe
Joe Bartosiewicz, CFP®
Investment Advisor Representative
860-940-7020 or 860-404-0408
SECURITIES AND ADVISORY SERVICES OFFERED THROUGH SAGE POINT FINANCIAL INC., MEMBER FINRA/SIPC, AND SEC-REGISTERED INVESTMENT ADVISOR.
Charts provided by AIQ Systems:
Technical Analysis is based on a study of historical price movements and past trend patterns. There is no assurance that these market changes or trends can or will be duplicated shortly. It logically follows that historical precedent does not guarantee future results. Conclusions expressed in the Technical Analysis section are personal opinions: and may not be construed as recommendations to buy or sell anything.
Disclaimer: The views expressed are not necessarily the view of Sage Point Financial, Inc. and should not be interpreted directly or indirectly as an offer to buy or sell any securities mentioned herein. Securities and Advisory services offered through Sage Point Financial Inc., Member FINRA/SIPC, an SEC-registered investment advisor.
Past performance cannot guarantee future results. Investing involves risk, including the potential loss of principal. No investment strategy can guarantee a profit or protect against loss in periods of declining values. Please note that individual situations can vary. Therefore, the information presented in this letter should only be relied upon when coordinated with individual professional advice. *There is no guarantee that a diversified portfolio will outperform a non-diversified portfolio in any given market environment. No investment strategy, such as asset allocation, can guarantee a profit or protect against loss in periods of declining values.
It is our goal to help investors by identifying changing market conditions. However, investors should be aware that no investment advisor can accurately predict all of the changes that may occur in the market.
The price of commodities is subject to substantial price fluctuations of short periods and may be affected by unpredictable international monetary and political policies. The market for commodities is widely unregulated, and concentrated investing may lead to Sector investing may involve a greater degree of risk than investments with broader diversification.
Indexes cannot be invested indirectly, are unmanaged, and do not incur management fees, costs, and expenses.
Dow Jones Industrial Average: A weighted price average of 30 significant stocks traded on the New York Stock Exchange and the NASDAQ.
S&P 500: The S&P 500 is an unmanaged indexed comprised of 500 widely held securities considered to be representative of the stock market in general.
NASDAQ: the NASDAQ Composite Index is an unmanaged, market-weighted index of all over the counter common stocks traded on the National Association of Securities Dealers Automated Quotation System
(IWM) I Shares Russell 2000 ETF: Which tracks the Russell 2000 index: which measures the performance of the small capitalization sector of the U.S. equity market.
A Moderate Mutual Fund risk mutual has approximately 50-70% of its portfolio in different equities, from growth, income stocks, international and emerging markets stocks to 30-50% of its portfolio indifferent categories of bonds and cash. It seeks capital appreciation with a low to moderate level of current income.
The Merrill Lynch High Yield Master Index: A broad-based measure of the performance of non-investment grade US Bonds
MSCI EAFE: the MSCI EAFE Index (Morgan Stanley Capital International Europe, Australia, and Far East Index) is a widely recognized benchmark of non-US markets. It is an unmanaged index composed of a sample of companies’ representative of the market structure of 20 European and Pacific Basin countries and includes reinvestment of all dividends.
Investment grade bond index: The S&P 500 Investment-grade corporate bond index, a sub-index of the S&P 500 Bond Index, seeks to measure the performance of the US corporate debt issued by constituents in the S&P 500 with an investment grade rating. The S&P 500 Bond index is designed to be a corporate-bond counterpart to the S&P 500, which is widely regarded as the best single gauge of large cap US equities.
Floating Rate Bond Index is a rule-based, market-value weighted index engineered to measure the performance and characteristics of floating rate coupon U.S. Treasuries which have a maturity greater than 12 months.
Joe Bartosiewicz, CFP®
5 Colby Way
Avon, CT 06001
860-940-7020 or 860-404-0408