Category Archives: Stocks & Commodities traders tips

Trading Gap Reversals

The AIQ code based on Ken Calhoun’s article in April 2016 issue of Stock & Commodities Trading Gap Reversals”, is provided below. 
AIQ has also posted the EDS file at “ is provided for downloading at 
Save this file to your/wintes32/EDS Strategies folder.
Since I mainly work with daily bar strategies, I wanted to test the gap-down concept on a daily bar trading system rather than on one-minute bars. I set up a system that buys after a stock has gapped down at least 10% in the last two days and then trades above the high of the gap-down bar. The entry is then at the close of that bar. For exits, I used the built-in exit, the profit-protect exit set at 80% once profit reaches 3% or more combined with a stop-loss using the low of the gap-down bar and also a time exit set to five bars. 
I then ran this system on the NASDAQ 100 list of stocks in the EDS backtester over the period 12/31/1999 to 1/11/2016 (Figure 7). The system generated 303 trades with an average profit of 1.09% per trade with a reward-to-risk ratio of 1.35. Slippage and commissions have not been deducted from these results.
Sample Chart
FIGURE 7: AIQ. This shows the EDS test results for the example system.
Again, the code and EDS file can be downloaded from www.TradersEdgeSystems.com/traderstips.htm, and is also shown below.
!TRADING GAP REVERSALS
!Author: Ken Calhoun, TASC April 2016
!Coded by: Richard Denning 2/1/2016
!www.TradersEdgeSystems.com

!INPUTS:
GapSize is 10.
GapLookBack is 5.
MaxBars is 5.

!CODING ABBREVIATIONS:
H is [high].
C is [close].
C1 is val([close],1).
L is [low].
O is [open].

GapD is (O / C1 - 1) * 100.
GapOS is scanany(GapD < -GapSize,GapLookBack) <> nodate()
  then offsettodate(month(),day(),year()).
Hgap  is valresult(H,^GapOS).
Lgap  is valresult(L,^GapOS).
SU if  scanany(GapD < -GapSize,GapLookBack).
SU1 if  scanany(GapD < -GapSize,GapLookBack,1).
SU2 if  scanany(GapD < -GapSize,GapLookBack,2).
LE if ((SU1 then resetdate()) or (SU2 then resetdate())) 
 and H > Hgap.
ExitLong if {position days} > maxBars
 or C < Lgap.
EntryPr is max(O,Hgap).
List  if C > 0.
—Richard Denning

Back to Basics with MACD (Part 2)

In this article I detailed one relatively “simple” approach to using the MACD indicator to identify potentially bullish opportunities.  In this piece we will look at one to actually put those signals to use.
The Limited Risk Call Option
One possibility upon generating a bullish signal as described in the last article is to buy shares of the stock/ETF/index/etc in question.  Not a thing wrong with that.  But there is a less expensive alternative.
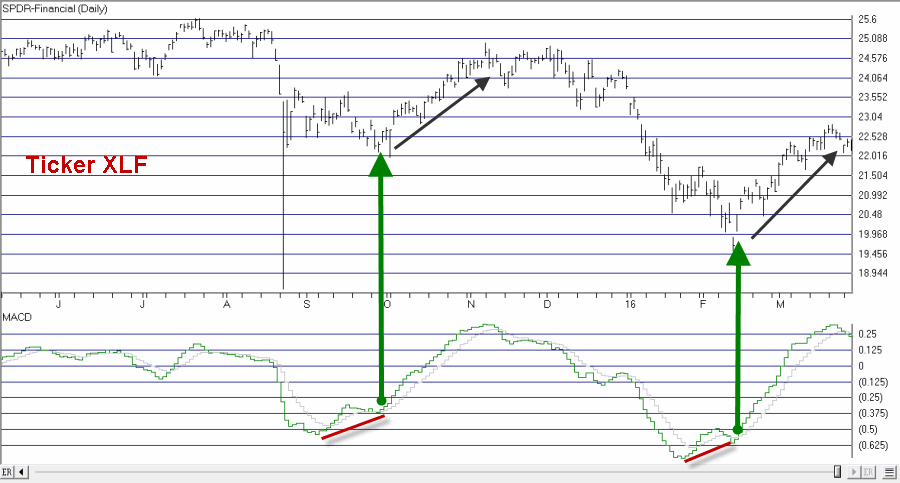
Figure 1 reproduces Figure 1 from the last piece showing ticker XLF.  Let’s look at the signal generated on 2/12/16.
1Figure 1 – Ticker XLF (Courtesy AIQ TradingExpert)
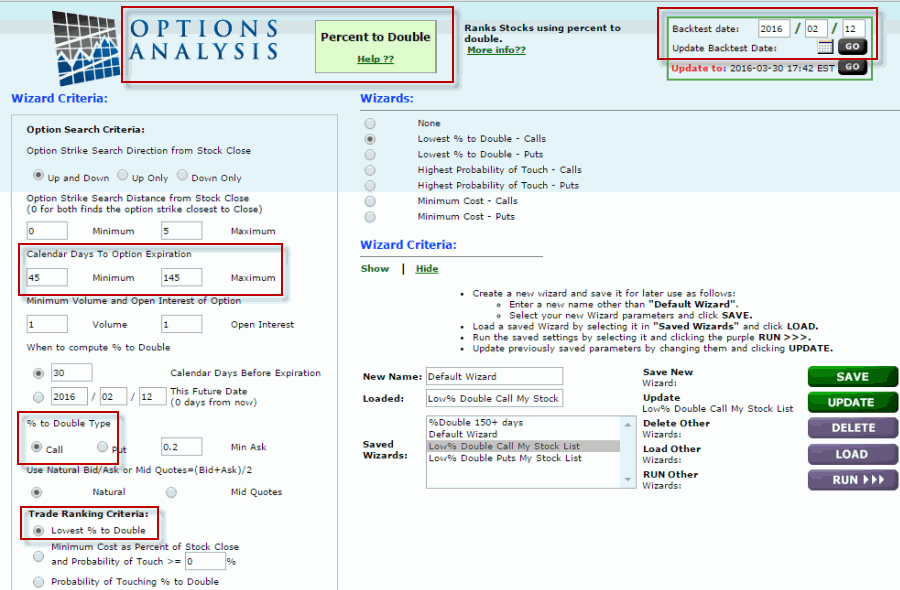
One alternative that I like is to use the “Percent to Double” routine at www.OptionsAnalysis.com to find an inexpensive call option that has lot of upside potential.  The input screen with a few key input selections highlighted appears in Figure 1a (if it looks intimidating please note that a reusable set of criteria can be captured in a “Saved Wizard”, which appear towards the lower right of of Figure 1a.  Once a set of criteria is saved it can be reused by simply clicking on the Wizard name and clicking “Load”.)
NOTE: My own personal preference is to consider options that have at least 45 days left until expiration (as time decay can become a very negative factor as option expiration draws closer).

1a

Figure 1a – Percent to Double Inputs (Courtesy www.OptionsAnalysis.com)

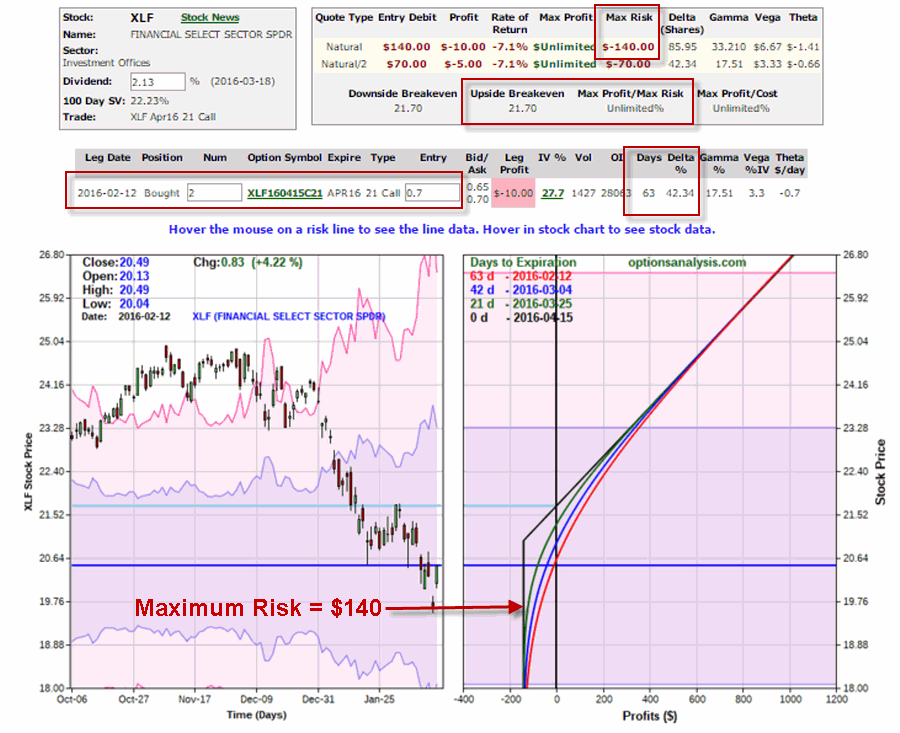
Figure 1b displays the output screen.
NOTE: For my own purposes I like to see a Delta of at least 40 for the option I might consider buying (nothing “scientific” here.  It is just that the lower the Delta the further out-of-the-money the option strike price is. I prefer to buy a strike price that is not too far from the current price of the stock; hence I look for a Delta of 40 or higher).  With XLF trading at $20.49, in Figure 1b I have highlighted the 2nd choice on the list – the April 21 call – which has a delta of 43.1bFigure 1b – Percent to Double Output (Courtesy www.OptionsAnalysis.com)
So a trader now has two alternatives:
*Buy 2 Apr 21 strike price XLF calls for $70 apiece ($140 total cost; 86 total deltas)
*Buy 86 shares of XLF at $20.49 apiece ($1,760 total cost, 86 total deltas)
Figure 1c displays the particulars for buying a 2-lot of the April 21 call for a total cost of $140.1cFigure 1c – XLF Apr 21 call (Courtesy www.OptionsAnalysis.com)
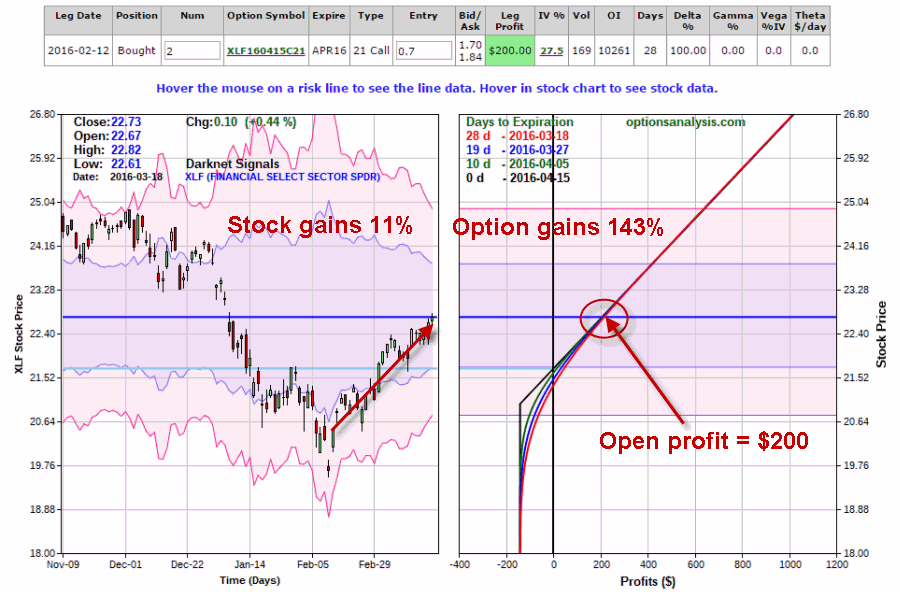
By 3/18 the shares had gained 11% and the Apr 21 call had gained 143%.  See Figure 1d.1dFigure 1d – XLF Apr 21 call (Courtesy www.OptionsAnalysis.com)
Summary
Obviously not every trade works out as well as this one.  Still, the key things to remember are:
*The option trade cost $140 instead of $1760
*The worst case scenario was a loss of $140.
Something to think about.
Chief Market Analyst at JayOnTheMarkets.com and TradingExpert Pro client

Back to Basics with MACD

One danger of getting “way to into” the financial markets is that you can find yourself progressing into some needlessly complicated stuff (“Hi, my name is Jay”).  I mean it is only natural to wonder “hey, what if I divided this indicator value by that indicator value” and such.  But once you start finding yourself taking an exponential moving average of a regression line with a variable lag time, well, you can find yourself “a tad far afield.”  (Trust me on this one).  Which leads us directly to:
Jay’sTradingMaxim #44: Every once in awhile it pays to remember that the end goal is simply to make money.  The more easily the better.
So today let’s go back to a simple “basic approach.”
The Bullish MACD Divergence
We will define an “asset” as any stock, ETF, commodity, index, etc. that can be traded on an exchange (and for my purposes, there should be a liquid market for options on that asset).
Step 1. An asset price falls to a new 20-day low and the MACD value is less than 0.  Note the MACD value on this date.
Step 2. Not less than one week but not more than 2 months later:
*Price closes below its closing level in Step 1
*The MACD indicator is above its level at the time of Step 1
Step 3. The next time the daily MACD indicator “ticks higher” a buy alert is triggered
Can it really be that simple?  The Good News is “Yes, it can.”  The Bad News is that “It isn’t always.”  To put it another way, like a lot of trading methods it can generate a surprising abundance of useful trading signals.  However, there is no guarantee that any given signal will turn out to be timely.  In other words:
This method gives you a good guideline for when to get in, but:
*It may be early at times (i.e., price will move lower still before advancing)
*It will at times be flat out wrong
*You still have to decide when to exit the bullish position.
*Call options are useful with this approach as it allows you to risk a limited amount of capital.
Examples
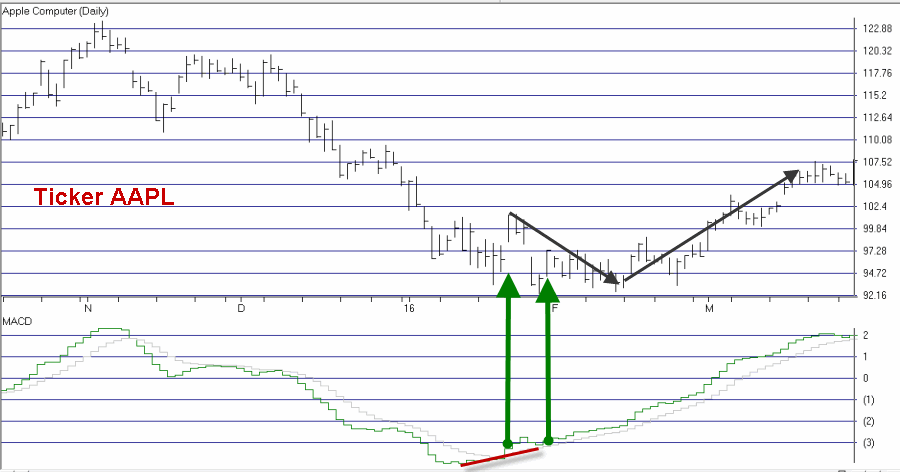
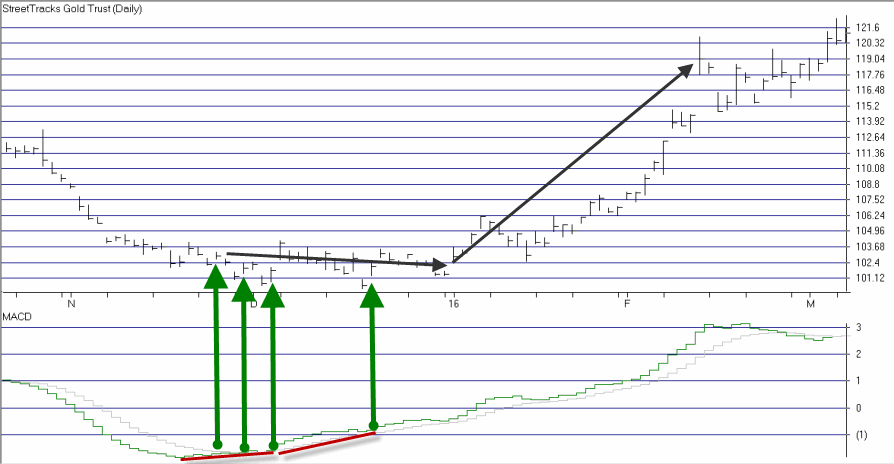
Figures 1 through 4 highlight some recent examples using this method.  Note that the charts show only entry points.  Exit points are “a separate topic”.
1
Figure 1 – Ticker XLF (Courtesy TradingExpert Pro)
2
Figure 2 – Ticker WMT (Courtesy TradingExpert)
3
Figure 3 – Ticker AAPL (Courtesy TradingExpert)
4
Figure 4 – Ticker GDX (Courtesy TradingExpert)
As you can see, some signals were quite timely while others were quite early.  For the record, I started getting bullish on gold and gold stocks early in 2016 based in part on the multiple alerts that appear in Figure 4.
Chief Market Analyst at JayOnTheMarkets.com and TradingExpert Pro client

ADX Breakouts

The AIQ code based on Ken Calhoun’s article in the March 2016 issue of Stocks and Commodities, “ADX Breakouts,” is provided at www.TradersEdgeSystems.com/traderstips.htm.
Since I mainly work with daily bar strategies, I wanted to test the ADX concept from the article on a daily bar trading system. So I set up a system that buys after a stock has based around the 200-day simple moving average (Basing200). Basing200 is coded in the system as:
  • The stock closing above the 200-SMA only 19 bars or less out of the last 100 bars, and
  • The stock closing greater than two bars above the 200-SMA in the last 10 bars.
For exits, I used the following built-in exits: a capital-protect exit set at 80% and a profit-protect exit set at 80% once profit reaches 5% or more.
I ran this system on the NASDAQ 100 list of stocks in the EDS backtester over the period 12/31/1999 to 1/11/2016. I then ran a second test on the system using the ADX filter (ADX must be greater than 40 at the time of the signal to buy). I used the same list of stocks, exits, and test period.
Figure 8 shows the first test without the filter: 883 trades, 1.84% average profit per trade, 1.51 reward/risk. Figure 9 shows the second test with the filter: 151 trades, 2.12% average profit per trade, 1.66 reward/risk.
Sample Chart
FIGURE 8: AIQ, WITHOUT FILTER. Here are the EDS test results for the example system without the ADX filter.
Sample Chart

FIGURE 9: AIQ, WITH FILTER. Here are the EDS test results for the example system with the ADX filter.
Although all of the key metrics are better with the filter, there is a significant reduction in the number of trades. In fact, 151 trades would not be sufficient for a trading system over this long test period. If one wanted to use the filter, then the list of stocks would need to be increased to about 2,000 stocks.
!ADX BREAKOUTS
!Author: Ken Calhoun, TASC March 2016
!Coded by: Richard Denning, 1/11/2016
!www.TradersEdgeSystems.com

!NOTE; THIS SAMPLE SYSTEM IS FOR 
           !DAILY BAR TESTING OF ADX FILTER ONLY

SMA200 is simpleavg([close],200).
HD is hasdatafor(250).
Above200 if ( [close] > SMA200 ) .
Basing200 if CountOf(Above200,10) >2
 and CountOf(Above200,100) 200. 
ADXhi if [ADX] >= 40.
BuyADX if Buy and ADXhi.
This code and EDS file can be downloaded from www.TradersEdgeSystems.com/traderstips.htm.
—Richard Denning
info@TradersEdgeSystems.com
for AIQ Systems

Higher Highs and Lower Lows

The AIQ code based on Vitali Apirine’s article in February  issue of Stocks and Commodities, “Higher Highs and Lower Lows,” is shown here.
The code provided computes the indicator values for the HHS and LLS indicators as well as allowing us to plot the indicator on a chart.
Figure 8 shows the indicator on a chart of Align Technology (ALGN).

Sample Chart

FIGURE 8: AIQ. Here, the HHS and LLS indicators are shown on a chart of ALGN.
EDS code is shown below.

!HIGHER HIGHS AND LOWER LOWS

!Author: Vitali Aprine, TASC Feb 2016

!Coded by: Richard Denning, 12/09/2015

!TradersEdgeSystems.com