The AIQ code based on Vitali Apirine’s article in December 2017 issue of Stocks and Commodities magazine, “Weekly & Daily MACD,” is provided below.
The moving average convergence/divergence oscillator (MACD), developed by Gerald Appel, is one of the more popular technical analysis indicators. The MACD is typically used on a single timeframe, but what if we looked at two timeframes on one chart?
Traders can look for relative daily MACD line crossovers, weekly and daily centerline crossovers, and divergences to generate trading signals.
Figure 5 shows the daily & weekly MACD indicator on a chart of Apple Inc. (AAPL) during 2016 and 2017, when there was a change from a downtrend to an uptrend.
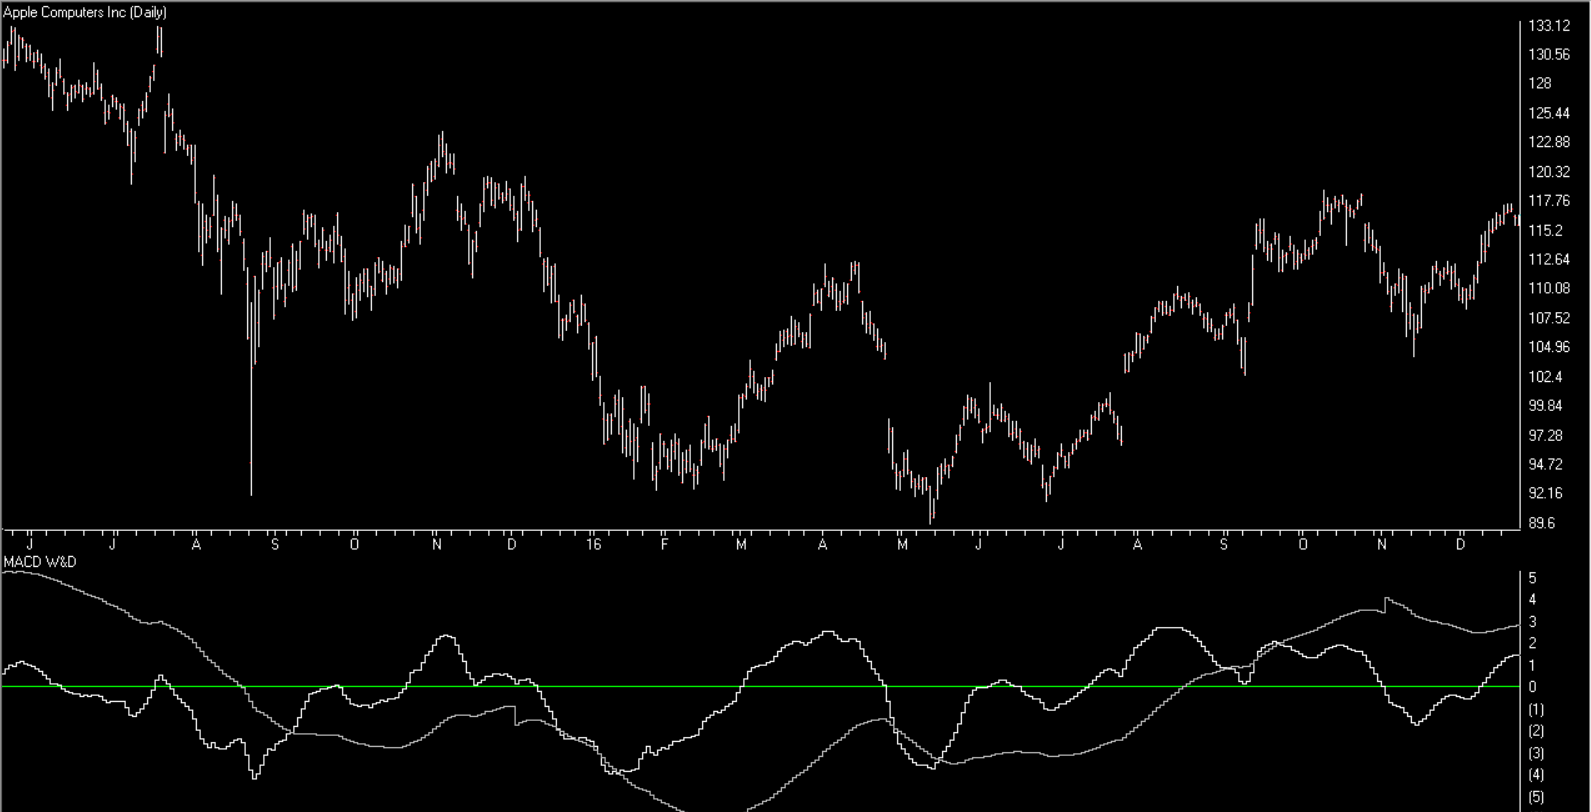
FIGURE 5: AIQ. Here is an example of the daily & weekly MACD on a chart of AAPL.
The code and EDS file can be downloaded from http://aiqsystems.com/dailyweeklyMACD.EDS, or copied here:
!WEEKLY & DAILY MACD
!Author: Vitali Apirine, TASC Dec 2017
!Coded by: Richard Denning 10/13/17
!www.TradersEdgeSystems.com

!INPUTS:
S is 12.
L is 25.

EMA1 is expavg([Close],S).
EMA2 is expavg([Close],L).
EMA3 is expavg([Close],S*5).
EMA4 is expavg([Close],L*5).
MACD is EMA1 - EMA2.
MACDW is EMA3 - EMA4.
rdMACD is MACD + MACDW.