Category Archives: jay kaeppel

When to Buy Energy Stocks

Crude oil and pretty much the entire energy sector has been crushed in recent months. This type of action sometimes causes investors to wonder if a buying opportunity may be forming.

The answer may well be, “Yes, but not just yet.”

Seasonality and Energy

Historically the energy sector shows strength during the February into May period.  This is especially true if the November through January period is negative.  Let’s take a closer look.

The Test

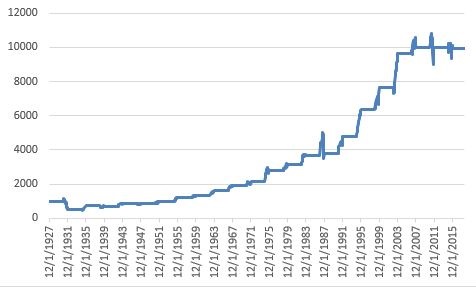
If Fidelity Select Energy (ticker FSENX) shows a loss during November through January then we will buy and hold FSENX from the end of January through the end of May.  The cumulative growth of $1,000 appears in Figure 1 and the yearly results in Figure 2.

1

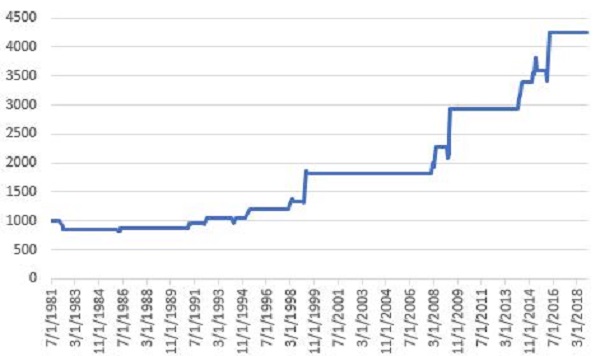
Figure 1 – Growth of $1,000 invested in FSENX ONLY during Feb-May ONLY IF Nov-Jan shows a loss

2

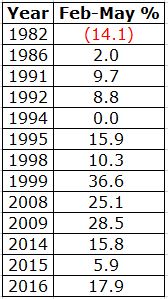
Figure 2 – % + (-) from holding FSENX during Feb-May ONLY IF Nov-Jan shows a loss

Figure 3 displays ticker XLE (an energy ETF that tracks loosely with FSENX).  As you can see, at the moment the Nov-Jan return is down roughly -15%.

3

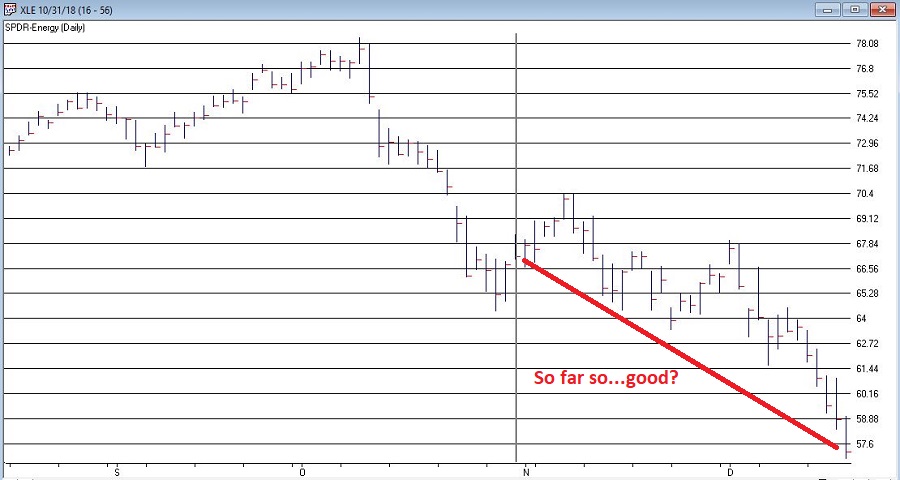
Figure 3 – Ticker XLE (Courtesy AIQ TradingExpert)

All of this suggests remaining patient and not trying to pick a bottom in the fickle energy sector. If, however, the energy sector shows a 3-month loss at the end of January, history suggests a buying opportunity may then be at end.

Summary

Paraphrasing here – “Patience, ah, people, patience”.

Jay Kaeppel

Disclaimer:  The data presented herein were obtained from various third-party sources.  While I believe the data to be reliable, no representation is made as to, and no responsibility, warranty or liability is accepted for the accuracy or completeness of such information.  The information, opinions and ideas expressed herein are for informational and educational purposes only and do not constitute and should not be construed as investment advice, an advertisement or offering of investment advisory services, or an offer to sell or a solicitation to buy any security.

Focus on “Investing” (not “the Market”)

I don’t offer “investment advice” here at JOTM so I have not commented much on the recent action of the market lest someone thinks I am “predicting” what will happen next.  Like most people, predicting the future is not one of my strengths.  I do have some thoughts though (which my doctor says is a good thing).

The Big Picture

Instead of talking about “the markets”, let’s talk first about “investing”, since that is really the heart of the matter.  “The markets” are simply a means to an end (i.e., accumulating wealth) which is accomplished by “investing”.  So, let me just run this one past you and you can think about it for a moment and see if it makes sense.

Macro Suggestion

*30% invested on a buy-and-hold basis

*30% invested using trend-following methods

*30% invested using tactical strategies

*10% whatever

30% Buy-and-Hold: Avoid the mistake that I made way back when – of thinking that you should always be 100% in or 100% out of the market.  No one gets timing right all the time.  And being 100% on the wrong side is pretty awful.  Put some portion of money into the market and leave it there.  You know, for all those times the market goes up when you think it shouldn’t.

30% using trend-following methods:  Let me just put this thought out there – one of the biggest keys to achieving long-term investment success in the stock market is avoiding some portion of those grueling 30% to 89% (1929-1932) declines that rip your investment soul from you body and make you never want to invest again.  Adopt some sort of trend-following method (or methods) so that when it all hits the fan you have some portion of your money “not getting killed”.

30% invested using (several) tactical strategies: For some examples of tactical strategies see hereherehere and here.  Not recommending these per se, but they do serve as decent examples.

10% whatever:  Got a hankering to buy a speculative stock?  Go ahead.  Want to trade options?  OK.  Want to buy commodity ETFs or closed-end funds or day-trade QQQ?  No problem.  Just make sure you don’t devote more than 10% of your capital to your “wild side.”

When the market is soaring you will likely have at a minimum 60% to 90% of your capital invested in the market.  And when it all goes south you will have at least 30% and probably more out of the market ready to reinvest when the worm turns.

Think about it.

The Current State of Affairs  

What follows are strictly (highly conflicted) opinions.  Overall sentiment seems to me to be very bearish – typically a bullish contrarian sign.  However, a lot of people whose opinions I respect are among those that are bearish.  So, it is not so easy to just “go the other way.”  But here is how I see the current “conflict”.

From a “technical” standpoint, things look awful.  Figures 1 and 2 show 4 major market averages and my 4 “bellwethers”.  They all look terrible.  Price breaking down below moving averages, moving average rolling over, and so on and so forth.  From a trend-following perspective this is bearish, so it makes sense to be “playing defense” with a portion of your capital as discussed above.

(click any Figure to enlarge)

1

Figure 1 – Major market averages with 50-day and 200-day moving averages (Courtesy AIQ TradingExpert)

2

Figure 2 – Jay’s Market Bellwethers with 50-day and 200-day moving averages (Courtesy AIQ TradingExpert)

On the flip side, the market is getting extremely oversold by some measure and we are on the cusp of a pre-election year – which has been by far the best historical performing year within the election cycle.

Figure 3 displays a post by the esteemed Walter Murphy regarding an old Marty Zweig indicator.  It looks at the 60-day average of the ratio of NYSE new highs to New Lows.  Low readings typically have marked good buying opportunities.

3

Figure 3 – Marty Zweig Oversold Indicator (Source: Walter Murphy on Twitter)

Figure 4 displays the growth of $1,000 invested in the S&P 500 Index ONLY during pre-election years starting in 1927.  Make no mistake, pre-election year gains are no “sure thing.”  But the long-term track record is pretty good.

4

Figure 4 – Growth of $1,00 invested in S&P 500 Index ONLY during pre-election years (1927-present)

There is no guarantee that an oversold market won’t continue to decline.  And seasonal trends are not guaranteed to work “the next time.”  But when you get an oversold market heading into a favorable seasonal period, don’t close your eyes to the bullish potential.

Summary

Too many investors seem to think in absolute terms – i.e., I must be fully invested OR I must be out.  This is (in my opinion) a mistake.   It makes perfect sense to be playing some defense given the current price action.  But try not to buy into the “doomsday” scenarios you might read about.  And don’t be surprised (and remember to get back in) if the market surprises in 2019.

Jay Kaeppel

Disclaimer:  The data presented herein were obtained from various third-party sources.  While I believe the data to be reliable, no representation is made as to, and no responsibility, warranty or liability is accepted for the accuracy or completeness of such information.  The information, opinions and ideas expressed herein are for informational and educational purposes only and do not constitute and should not be construed as investment advice, an advertisement or offering of investment advisory services,

The Two Most Important Bond Market Charts

A funny thing happened on the way that bond bear market.  But first the promised charts:
*Figure 1 strongly suggests that the next major move in bond yields is higher (as yields tend to move in roughly 30-year up and 30-year down waves).
1Figure 1 – 60-year bond yield cycle (Courtesy: www.mcoscillator.com)

*Figure 2 displays the 10-year treasury note yield – with a long, long downtrend followed by an advance to a potential “fake out breakout” to the upside.  More to follow.
2Figure 2 – 10-year treasury yields (x10); ticker TNX (Courtesy AIQ TradingExpert)

Now for the recap:
*The 10-year treasury yield (TNX) topped out in the early 1980’s and declined to a low in July 2012.
*TNX then moved higher for about a year, then drifted lower to its ultimate low around 1.35 three years later in 2016.
*From there rates rose to roughly 3.25% by October 2018.  Along the way it took out its 120-month moving average, a horizontal resistance line at about 3.04% and finally a downward sloping trend line in October 2018.
*With “final resistance” pierced many bond market prognosticators assumed that yields were off to the races.
*And then that “funny thing” happened.  10-year yields fell from 3.25% in October to a recent level of roughly 2.90%.
At this point “predicting” where TNX is headed in the short run from here is pure conjecture.  There is a chance that rates will not rally anytime soon and that they may even continue to drift back lower.  Take your pick.  Flip a coin.  Whatever.  The bottom line is that what you see in Figure 2 is entirely in “the eye of the beholder.”
So let’s circle back to Figure 1.  The bottom line is this:
*The odds appear very good that the next 30 years in in bond yield will look a lot different than the last 30 years, when high grade bond yield fell from 15% to roughly 3% (which is OK, because if rates ever go negative and I have to pay the government just to hold my money I am going to be really pissed….but I digress).
*Short-term “traders” can trade long-term bonds to their hearts content.  However, “investors” may be wise to avoid long-term bonds.  Consider ticker TLT, the iShares 20+ year treasury bond ETF.  It presently has a 30-day SEC yield of 3.06% and an “average duration” of 17.42 years.  Here is how to understand that:
Regarding yield, if price remained completely unchanged, and investor would theoretically earn roughly 3.06% in interest over the next 12 months
Regarding duration, if interest rates rose one full percentage point, ticker TLT would theoretically lose -17.42% in value
Long-term bonds may rally from time to time.  However, for long-term investors holding bonds, this is NOT a favorable reward-to-risk tradeoff.
Summary
In the “big picture” we probably are in a long-term bear market for bonds.  But it may not look like it for a while.  So trade in and out as much as you’d like.  But for bond investment purposes I am keeping duration short.
Jay Kaeppel
Disclaimer:  The data presented herein were obtained from various third-party sources.  While I believe the data to be reliable, no representation is made as to, and no responsibility, warranty or liability is accepted for the accuracy or completeness of such information.  The information, opinions and ideas expressed herein are for informational and educational purposes only and do not constitute and should not be construed as investment advice, an advertisement or offering of investment advisory services, or an offer to sell or a solicitation to buy any security.

An Obscure but Potentially Useful Oversold Indicator

Trend-following is essentially a “tried and true’ approach to investing.  But overbought/oversold (i.e., attempting to buy low/sell high) – that’s where the “excitement” is.  Of course, when it comes to trading and investing, “excitement” can be highly overrated.  Nevertheless, in this piece I want to talk about a relatively obscure indicator that may be useful in identifying vastly oversold situations.

EDITORS NOTE: The AIQ EDS file for Jay Kaeppel’s indicator is available to download at

The VixRSI14 Indicator

Part of the reason this indicator is obscure is because I think I “invented” it – but only by mashing together an indicator from Larry Williams and an indicator from Welles Wilder.  The first part is the standard Welles Wilder 14-day Relative Strength Index, more commonly referred to as “RSI”.

The 2nd part of VixRSI14 is an indicator created by famed trader Larry Williams which he dubbed “VixFix”.  This indicator is an effort to create a “Vix Index-like” indicator for any security.

AIQ TradingExpert code for these indicators appears at the end of the article.

A Few Notes

*For the record, VixRSI14 is calculated by taking a 3-day exponential average of VixFix and dividing that by a 3-day exponential average of RSI14 (are we having fun yet?).  Please see code at the end of the article.

*I prefer to use VixRSI14 using weekly data rather than daily data

*(Unfortunately) There are no “magic numbers” that indicate that a completely risk-free, you can’t lose, just buy now and watch the money roll in” buying opportunity is at hand (Disclaimer: If there was, I would probably just keep it to myself and not bother writing the article – sorry, it’s just my nature).  That being said, a decent “rule of thumb” is to look for a reading above 3.5 followed by a downside reversal.

(Click any chart below to enlarge)

With those thoughts in mind, Figure 1 displays a weekly chart of Wynn Resorts (WYNN) with the two indicators plotted separately below the bar chart.1

Figure 1 – WYNN with William’s VixFix and Wilder’s RSI 14-day (Courtesy AIQ TradingExpert)

Note that as price declines, VixFix tends to rise and RSI14 tends to fall.  VIXRSI14 essentially identifies “extremes” in the difference between these two.  Figure 2 displays WYNN with VixRSI14 plotted below the bar chart.

2

Figure 2 – WYNN with VixRSI14 (Courtesy AIQ TradingExpert)

More “examples” appear in Figures 3 through 8 below.

3

Figure 3 – AMD (Courtesy AIQ TradingExpert)

4

Figure 4 – BAC (Courtesy AIQ TradingExpert)

5

Figure 5 – DISH (Courtesy AIQ TradingExpert)

6

Figure 6 – GRMN (Courtesy AIQ TradingExpert)

7

Figure 7 – NTAP (Courtesy AIQ TradingExpert)

8

Figure 8 – YHOO (Courtesy AIQ TradingExpert)

Summary

As always, I merely present “ideas” here at JOTM.  So, do not assume from the charts above that you have found the “keys to the kingdom”.  But if used in conjunction with other confirming indicators – and remembering to employ some sort of risk control for those instances when a stock price decline fails to arrest itself even after VixRSI4 peaks above 3.5 – VixRSI14 may hold some value.

Indicator Code

EDITORS NOTE: The AIQ EDS file for Jay Kaeppel’s indicator is available to download at

Below is the code for VixFix, RSI14 and VixRSI14 from AIQ Expert Design Studio.

!#######################################

!VixFix indicator code

hivalclose is hival([close],22).

vixfix is (((hivalclose-[low])/hivalclose)*100)+50.

!#######################################

!#######################################

!RSI14 code

Define days14 27.

U14 is [close]-val([close],1).

D14 is val([close],1)-[close].

AvgU14 is ExpAvg(iff(U14>0,U14,0),days14).

AvgD14 is ExpAvg(iff(D14>=0,D14,0),days14).

RSI14 is 100-(100/(1+(AvgU14/AvgD14))).

!#######################################

!#######################################

!VixRSI14 code

VixRSI14 is expavg(vixfix,3)/expavg(RSI14,3).

!#######################################

Jay Kaeppel

Disclaimer:  The data presented herein were obtained from various third-party sources.  While I believe the data to be reliable, no representation is made as to, and no responsibility, warranty or liability is accepted for the accuracy or completeness of such information.  The information, opinions and ideas expressed herein are for informational and educational purposes only and do not constitute and should not be construed as investment advice, an advertisement or offering of investment advisory services, or an offer to sell or a solicitation to buy any security.

An Obscure But Useful Trend-Following Tool

Everyone has heard about trend-following.  And most traders have at least a foggy grasp of the relative pros and cons associated with trend following.  And anyone who has ever employed any type of trend-following technique is aware that they are great when there is an actual trend, but that whipsaws are inevitable.

What I am about to show you will not change these facts.  But today’s piece is just a “quickie” to highlight an obscure way to use a common indicator as a “confirmation/ denial” check when assessing the trend of a given security.  For the record, I am making no claim that this indicator generates profitably “trading signals in and of itself.  Its one of those things that – and I hate this phrase as much as you do but – should be used in conjunction with other indicators to get a good sense of the current “state of the trend” for a given security.

Nothing more, nothing less.

MACD Stretched Long

Most traders are familiar with the MACD indicator.  Originally popularized by Gerald Appel, it uses a set of moving averages to attempt to assess the trend in price (and many traders also use it to try to identify overbought or oversold situations).  Standard parameters are 9,26 and 12.  The version I use is different in several ways:

*Whereas the standard MACD generates two lines and a histogram can be drawn of the difference between the two, this version just generates one line – we will call in the trend line (catchy, no?)

*We will use parameters of 40 and 105

*One other note is that (at least according to me) this indicator is best used with weekly data.

The MACD4010501

Here is the formula for AIQ TradingExpert Expert Design Studio:

Define ss3 40.

Define L3 105.

ShortMACDMA3 is expavg([Close],ss3)*100.

LongMACDMA3 is expavg([Close],L3)*100.

MACD4010501Value is ShortMACDMA3-LongMACDMA3.

As I said this should be used with “other” indicators.  For example, one might consider the current price versus a 40-week moving average.

Standard Interpretation:

*If price is above the 40-week moving average (or if whatever other trend-following indicator you are using is bullish), AND

*The MACD4010501 is trend higher THEN

ONLY play the long side of that security

Likewise:

*If price is below the 40-week moving average (or if whatever other trend-following indicator you are using is bearish), AND

*The MACD4010501 is trend lower THEN

ONLY play the short side of that security (or at least DO NOT play the long side)

Finally, DO NOT assume that every change of trend in MACD4010501 is some sort of buy or sell signal.  Consider it only as a filter for your trades.

Some random examples appear in Figures 1 through 4 (click to enlarge any chart)

1

Figure 1 – AMZN (Courtesy AIQ TradingExpert)

2

Figure 2 – IBM (Courtesy AIQ TradingExpert)

3

Figure 3 – WMT (Courtesy AIQ TradingExpert)

4

Figure 4 – TLT (Courtesy AIQ TradingExpert)

Summary

To repeat, the proper use of this obscure version of the popular MACD indicator is as follows:

*Consider the trend of MACD4010501

*Consider one or more other trend-following indicators

*If there is bullish agreement, then apply your own shorter-term entry and exit techniques to trade the long side.

*If there is bearish agreement, then apply your own shorter-term entry and exit techniques to trade the short side (or simply stand aside).

Trade on!

Jay Kaeppel

Disclaimer:  The data presented herein were obtained from various third-party sources.  While I believe the data to be reliable, no representation is made as to, and no responsibility, warranty or liability is accepted for the accuracy or completeness of such information.  The information, opinions and ideas expressed herein are for informational and educational purposes only and do not constitute and should not be construed as investment advice, an advertisement or offering of investment advisory services, or an offer to sell or a solicitation to buy any security.