I haven’t written a lot lately. Mostly I guess because there doesn’t seem to be a lot new to say. As you can see in Figure 1, the major market indexes are in an uptrend. All 4 (Dow, S&P 500, Russell 2000 and Nasdaq 100) are above their respective 200-day MA’s and all but Russell 2000 have made new all-time highs.
As you can see in Figure 2, my market “bellwethers” are still slightly mixed. Semiconductors are above their 200-day MA and have broken out to a new high, Transports and the Value Line Index (a broad measure of the stock market) are holding above their 200-day MA’s but are well off all-time highs, and the inverse VIX ETF ticker ZIV is in a downtrend (ideally it should trend higher with the overall stock market).
As you can see in Figure 3, Gold, Bonds and the U.S. Dollar are still holding in uptrends above their respective 200-day MA’s (although all have backed off of recent highs) and crude oil is sort of “nowhere”.
Figure 3 – Gold, Bonds, U.S. Dollar and Crude Oil (Courtesy AIQ TradingExpert)
Like I said, nothing has really changed. So, at this point the real battle is that age-old conundrum of “Patience versus Complacency”. When the overall trend is clearly “Up” typically the best thing to do is essentially “nothing” (assuming you are already invested in the market). At the same time, the danger of extrapolating the current “good times” ad infinitum into the future always lurks nearby.
What we don’t want to see is:
*The major market averages breaking back down below their 200-day MA’s.
What we would like to see is:
*The Transports and the Value Line Index break out to new highs (this would be bullish confirmation rather the current potentially bearish divergence)
The Importance of New Highs in the Value Line Index
One development that would provide bullish confirmation for the stock market would be if the Value Line Geometric Index were to rally to a new 12-month high. It tends to be a bullish sign when this index reaches a new 12-month high after not having done so for at least 12-months.
Figure 4 displays the cumulative growth for the index for all trading days within 18 months of the first 12-month new high after at least 12-months without one.
Figure 4 – Cumulative growth for Value Line Geometric Index within 18-months of a new 12-month high
Figure 5 displays the cumulative growth for the index for all other trading days.
Figure 5 – Cumulative growth for Value Line Geometric Index during all other trading days
In Figure 4 we see that a bullish development (the first 12-month new high in at least 12 months) is typically followed by more bullish developments. In Figure 5 we see that all other trading days essentially amount to nothing.
Figure 6 displays the Value Line Geometric Index with the relevant new highs highlighted.
The trend at this very moment is “Up.” So sit back, relax and enjoy the ride. Just don’t ever forget that the ride WILL NOT last forever. If the Value Line Geometric Index (and also the Russell 2000 and the Dow Transports) joins the party then history suggests the party will be extended. If they don’t, the party may end sooner than expected.
So pay attention.
Jay Kaeppel
Disclaimer: The information, opinions and ideas expressed herein are for informational and educational purposes only and are based on research conducted and presented solely by the author. The information presented does not represent the views of the author only and does not constitute a complete description of any investment service. In addition, nothing presented herein should be construed as investment advice, as an advertisement or offering of investment advisory services, or as an offer to sell or a solicitation to buy any security. The data presented herein were obtained from various third-party sources. While the data is believed to be reliable, no representation is made as to, and no responsibility, warranty or liability is accepted for the accuracy or completeness of such information. International investments are subject to additional risks such as currency fluctuations, political instability and the potential for illiquid markets. Past performance is no guarantee of future results. There is risk of loss in all trading. Back tested performance does not represent actual performance and should not be interpreted as an indication of such performance. Also, back tested performance results have certain inherent limitations and differs from actual performance because it is achieved with the benefit of hindsight.
As the primary currency recognized around the globe, the U.S. Dollar is pretty important. And the trend of the dollar is pretty important also. While a strong dollar is good in terms of attracting capital to U.S. shores, it makes it more difficult for U.S. firms that export goods. One might argue that a “steady” dollar is generally preferable to a very strong or very weak dollar.
Speaking of the trend of the dollar, a lot of things move inversely to the dollar. In fact, one can typically argue that as long as the dollar is strong, certain “assets” will struggle to make major advances. These include – commodities in general, metals specifically, foreign currencies (obviously) and international bonds (strongly).
Let’s first take a look at the state of the dollar.
Ticker UUP
For our purposes we will use the ETF ticker UUP ( Invesco DB US Dollar Index Bullish Fund) to track the U.S. Dollar. Figure 1 displays a monthly chart and suggests that UUP just ran into – and reversed at least for now – in a significant zone of resistance.
Which way will things go? It beats me. But I for one will be keeping a close eye on UUP versus the resistance levels highlighted in Figures 1 and 2. So will traders of numerous other securities.
Inverse to the Buck
Figure 4 displays the 4-year weekly correlation for 5 ETFs to ticker UUP (a correlation of 1000 means they trade exactly the same a UUP and a correlation of -1000 means they trade exactly inversely to UUP).
In the following charts, note the inverse relationship between the dollar (UUP on the bottom) and the security in the top chart. When the dollar goes way down they tend to go way up – and vice versa.
Note also that in the last year several of these securities went up at the same time the dollar did. This is a historical anomaly and should not be expected to continue indefinitely.
Figure 8 – Ticker BWX (SPDR Bloomberg Barclays International Treasury Bond) vs. UUP (Courtesy AIQ TradingExpert )
Figure 9 – Ticker IBND (SPDR Bloomberg Barclays International Corporate Bond) vs. UUP (Courtesy AIQ TradingExpert )
Figure 10 – Ticker FXE (Invesco CurrencyShares Euro Currency Trust) vs UUP (Courtesy AIQ TradingExpert )
Summary
If the dollar fails to break out of it’s recent resistance area and actually begins to decline then commodities, currencies, metals and international stocks and bonds will gain a favorable headwind. How it all actually plays out, however, remains to be seen.
So keep an eye on the buck. Alot is riding on it – whichever way it goes.
Jay Kaeppel
Disclaimer: The data presented herein were obtained from various third-party sources. While I believe the data to be reliable, no representation is made as to, and no responsibility, warranty or liability is accepted for the accuracy or completeness of such information. The information, opinions and ideas expressed herein are for informational and educational purposes only and do not constitute and should not be construed as investment advice, an advertisement or offering of investment advisory services, or an offer to sell or a solicitation to buy any security.
Technology is what it’s all about these days. Technology (primarily) runs on semiconductors. If the semiconductor business is good, business is good. OK, that’s about as large a degree of oversimplification as I can manage. But while it may be overstated, there is definitely a certain amount of truth to it.
So, it can pay to keep an eye on the semiconductor sector. The simplest way to do that is to follow ticker SMH. Keeping with the mode of oversimplifying things, in a nutshell, if SMH is not acting terribly that’s typically a good thing. So where do all things SMH stand now? Let’s take a look.
Ticker SMH
As with all things market-related (among other things), beauty is in the eye of the beholder. A quick glance at Figure 1 argues that SMH is inarguably in a strong uptrend, well above its 200-day moving average
A glance at Figure 2 suggests that SMH has just completed 5 waves up and may be due for a decline.
Figure 2 – SMH with potentially bearish Elliott Wave count (Courtesy ProfitSource by HUBB)
And Figure 3 highlights a very obvious bearish divergence between SMH weekly price action and the 3-period RSI indicator – i.e., SMH keeps moving incrementally higher while RSI3 reaches slightly lower highs each time. Speaking anecdotally, this setup seems to presage at least a short-term decline maybe 70% of the time. Of course, the degree of decline varies also.
So, what does it all mean? First off, I am not going to make any predictions (if you knew my record on “predictions” you would thing that that is a good thing). I am simply going to point out that one way or the other SMH may be about to give us some important information.
Scenario 1 – SMH breaks out to the upside and stays there: If SMH breaks through the upside and runs, the odds are very high that the overall stock market will run with it.
Course of action: Play for a bullish run by the overall market into the end of the year.
Scenario 2 -SMH breaks out briefly to the upside but then falls back below the recent highs: This would be at least a short-term bearish sign. Failed breakouts are typically a bad sign and the security in question often behaves badly after disappointing bullish investors. In this case, if it happens to SMH it could follow through to the overall market.
Course of action: If this happens, you might consider “playing some defense” (hedging, raising some cash, etc.) . Failed breakouts often make the market a little “cranky” (and cranky is one of my fields of expertise).
Scenario 3: SMH fails to breakout and suffers an intermediate-term decline. If I were to fixate only on the bearish RSI3 divergence I showed earlier in Figure 3, this would seem like the most likely result.
Course of action: If SMH sells off without breaking above recent resistance, keep an eye on SMH price via its 200-day moving average. Simple interpretation goes like this: If SMH sells off but holds or regains it’s 200-day moving average then the bullish case can quickly be re-established; If SMH sells off and holds below its 200-day moving average, that should be considered a bearish sign for the overall market.
Jay Kaeppel
Disclaimer: The data presented herein were obtained from various third-party sources. While I believe the data to be reliable, no representation is made as to, and no responsibility, warranty or liability is accepted for the accuracy or completeness of such information. The information, opinions and ideas expressed herein are for informational and educational purposes only and do not constitute and should not be construed as investment advice, an advertisement or offering of investment advisory services, or an offer to sell or a solicitation to buy any security.
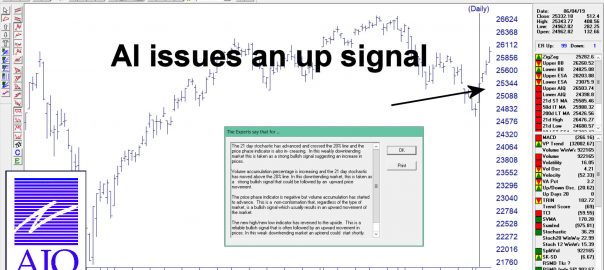
When AIQ released StockExpert in 1987, the Expert Ratings were the foundation of the system. This release represented the first software product developed for personal computers that used Artificial Intelligence to signal equity movement. AIQ’s founder and knowledge engineer, Dr. J.D. Smith, chose to use expert system technology that was developed at Stanford University in the late 60’s. An expert system uses a knowledge based rule driven structure.
Dr. Smith tested hundreds of technical rules that had been published by respected analysts.Those rules that tested well were placed into a knowledge base of rules. Rules were weighted based on their effectiveness. When a series of bullish rules was triggered, an Expert Rating buy signal was generated. A series of bearish rules generated an Expert Rating sell signal.
In this video Steve Hill explains the internal rules of the Expert System that generated the signal
The sell signal that the AI system issued on April 18, 2019 presaged a 2000 point move down. Things have now changed. On June 4, 2019 the AI system issued a buy signal.
The major stock indexes fell about 5% in May and rebounded most of the loss in June so far in one week. Source: CNBC.com
CURRENT EVENTS INFLUENCING MARKET MOVEMENT:
Stocks fell because of the Chinese and the 5% Mexican tariff announcement. There will probably be a positive announcement on the Mexican tariff front as tariffs will hurt our economy and the auto industry. In a positive development, Fed officials said they would be open to reducing interest rates if the tariffs weaken the economy. The current interest rate on the ten-year bond has dropped from 3.2% on the ten-year bond to about 2.10% now just in roughly six months. The affordability of buying a new house has gotten much better.
Trump will do what he can to shore up the economy, and if the markets fall, he is keenly aware of stemming any significant decline in the stock market as he wants to be reelected. The jobs report was a little weaker than was expected; that is why the Fed may reduce interest rates to keep the economy on an upward trajectory consistent with a 2-3% per year growth in the GDP. Overall, I am still positive on the economy unless full tariffs are enacted on the Mexican and the Chinese economies.
If they are expanded to the 25% fully enacted, I will be getting more cautious on the economy and the stock markets.
INTEREST RATE SCENARIO
The Federal funds rate is about 50 basis points or half of 1% higher than the two and five year Treasury Notes and has historically indicated that a recession is looming. The next few months will indicate whether the economy will soften. At this point, I don’t think it will decline as much as to go into recession, but there are still risks. Trump will determine what will happen to the economy. If the tariff situation is resolved, then I think the economy will still be in a growth phase, but if the tariffs are not resolved and get worse, the risks of a recession will increase dramatically.
MARKET RECAP:
Last month on my May 5th Bartometer I said that if the S&P 500 closes below 2,886 I will get VERY CAUTIOUS and It did. After that, it proceeded to 2,740 a drop OF 5%, AND my computer models gave a BUY signal ON 6/5/19, the big up day at 2,800, and it rallied to an intraday high of 2,885.85 and closed at 2875. Even though we are on the BUY-HOLD signal, I would like the S&P 500 to break out of 2886, preferably the 2,893 level and stay there for 2 to 3 days for me to believe the rally can approach the old highs of 2,954. See the charts for an explanation.
Index Averages
Some of the INDEXES of the markets both equities and interest rates are below. The source is Morningstar.com up until June 7, 2019.
*Dow Jones +12.50% S&P 500 +15.60% NASDAQ Aggressive growth +17.50% I Shares Russell 2000 ETF (IWM) Small cap +12.97% International Index (MSCI – EAFE ex USA) +9.97% Moderate Mutual Fund +8.20% Investment Grade Bonds (AAA) +7.03% +2.64% High Yield Merrill Lynch High Yield Index +7.39% +4.26% Floating Rate Bond Index +4.90% +2.60% Fixed Bond Yields (10 year) +2.10% Yield 2.63%
The average Moderate Fund is up 8.2% this year fully invested as a 60% in stocks and 40% in bonds.
If interest rates are peaking and look to be flattening or declining over the next year then investment grade or multisector bonds technically might be better than floating rate bonds. But diversification is important.
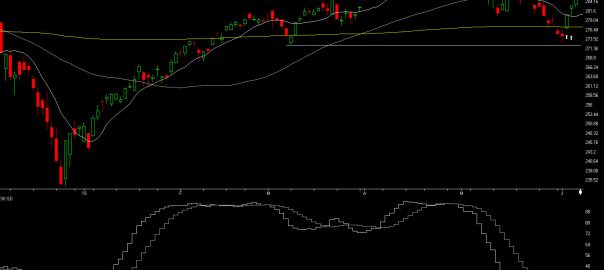
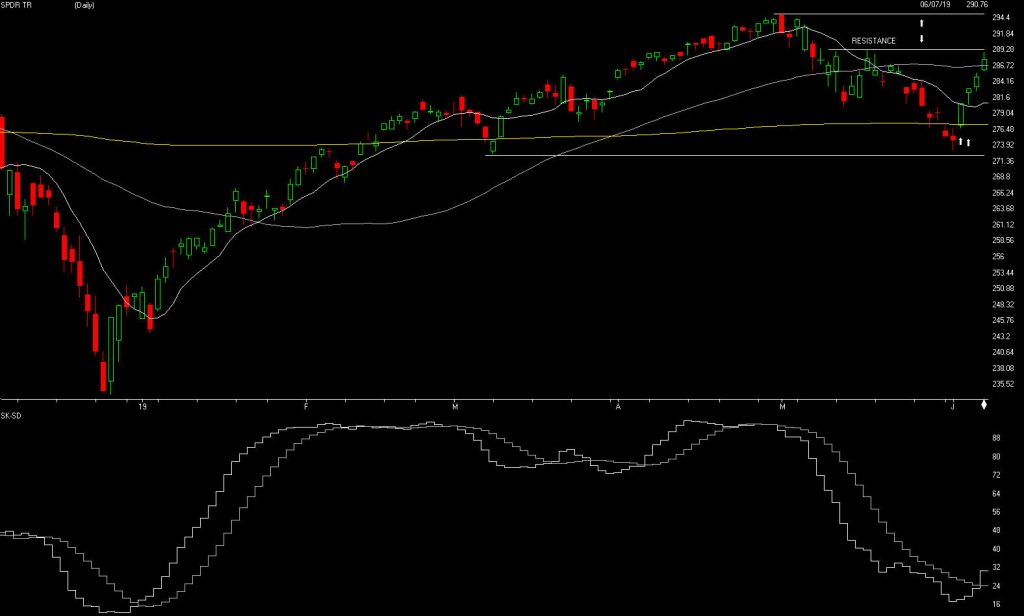
The S&P 500
Source: AIQ Systems
The S&P is above. Last month AIQ gave a SELL signal on April 18th but I went to a VERY CAUTIOUS the close below 2,886. The S&P dropped 5% after it closed below 2,886.
My models went to a BUY signal at 2,800 on 6/05/2019 the S&P now we are right back up to 2,875. Where do we go from here? If the 2,893 level can be broken on the Upside which I think it can and stay there for 2-3 days , then the S&P should approach its old high of 2,954 it hit on May 1, 2019. Notice the graph below the S&P. This chart is the SK-SD stochastics, it is breaking out on the upside and it shows the market is oversold and could continue to rally.
Source: Investopedia
*A Support or support level is the level at which buyers tend to purchase or into a stock or index. It refers to the stock share price that a company or index should hold and start to rise. When a price of the stock falls towards its support level, the support level holds and is confirmed, or the stock continues to decline, and the support level must change.
Support levels on the S&P 500 area are 2865, 2811, 2740, and 2683 areas. These might be BUY areas.
Support levels on the NASDAQ are 7704, 7414, 7291, and 7171.
On the Dow Jones support is at 25,943, 25739, 25,538 and 25,376. These may be safer areas to get into the equity markets on support levels slowly.
RESISTANCE LEVEL ON THE S&P 500 IS 2885. If there is a favorable tariff settlement, the market should rise short term.
THE BOTTOM LINE:
The S&P 500 is right at the point where it needs to break out of 2,893. I am still Moderately Bullish on the market and think it will break out. My computer technical models are on a short term buy signal, so do I think the S&P will breakout above 2,954, the old high it hit on May 1, 2019? We will see, but if it approaches that level, it will be imperative to watch the 2,954 level to see if it turns down. I will be watching that level to see if it is a breakout. If it cannot, then I would become Cautious again.
Best to all of you,
Joe Bartosiewicz, CFP® Investment Advisor Representative
5 Colby Way Avon, CT 06001 860-940-7020 or 860-404-0408
Contact information: SECURITIES AND ADVISORY SERVICES OFFERED THROUGH SAGE POINT FINANCIAL INC., MEMBER FINRA/SIPC, AND SEC-REGISTERED INVESTMENT ADVISOR.
Charts provided by AIQ Systems:
Technical Analysis is based on a study of historical price movements and past trend patterns. There is no assurance that these market changes or trends can or will be duplicated shortly. It logically follows that historical precedent does not guarantee future results. Conclusions expressed in the Technical Analysis section are personal opinions: and may not be construed as recommendations to buy or sell anything.
Disclaimer: The views expressed are not necessarily the view of Sage Point Financial, Inc. and should not be interpreted directly or indirectly as an offer to buy or sell any securities mentioned herein. Securities and Advisory services offered through Sage Point Financial Inc., Member FINRA/SIPC, and SEC-registered investment advisor. Past performance cannot guarantee future results. Investing involves risk, including the potential loss of principal. No investment strategy can guarantee a profit or protect against loss in periods of declining values. Please note that individual situations can vary. Therefore, the information presented in this letter should only be relied upon when coordinated with individual professional advice. *There is no guarantee that a diversified portfolio will outperform a non-diversified portfolio in any given market environment. No investment strategy, such as asset allocation, can guarantee a profit or protect against loss in periods of declining values. It is our goal to help investors by identifying changing market conditions. However, investors should be aware that no investment advisor can accurately predict all of the changes that may occur in the market. The price of commodities is subject to substantial price fluctuations of short periods and may be affected by unpredictable international monetary and political policies. The market for commodities is widely unregulated, and concentrated investing may lead to Sector investing may involve a greater degree of risk than investments with broader diversification. Indexes cannot be invested indirectly, are unmanaged, and do not incur management fees, costs, and expenses. Dow Jones Industrial Average: A weighted price average of 30 significant stocks traded on the New York Stock Exchange and the NASDAQ. S&P 500: The S&P 500 is an unmanaged indexed comprised of 500 widely held securities considered to be representative of the stock market in general. NASDAQ: the NASDAQ Composite Index is an unmanaged, market-weighted index of all over the counter common stocks traded on the National Association of Securities Dealers Automated Quotation System (IWM) I Shares Russell 2000 ETF: Which tracks the Russell 2000 index: which measures the performance of the small capitalization sector of the U.S. equity market. A Moderate Mutual Fund risk mutual has approximately 50-70% of its portfolio in different equities, from growth, income stocks, international and emerging markets stocks to 30-50% of its portfolio indifferent categories of bonds and cash. It seeks capital appreciation with a low to moderate level of current income. The Merrill Lynch High Yield Master Index: A broad-based measure of the performance of non-investment grade US Bonds MSCI EAFE: the MSCI EAFE Index (Morgan Stanley Capital International Europe, Australia, and Far East Index) is a widely recognized benchmark of non-US markets. It is an unmanaged index composed of a sample of companies’ representative of the market structure of 20 European and Pacific Basin countries and includes reinvestment of all dividends. Investment grade bond index: The S&P 500 Investment-grade corporate bond index, a sub-index of the S&P 500 Bond Index, seeks to measure the performance of the US corporate debt issued by constituents in the S&P 500 with an investment grade rating. The S&P 500 Bond index is designed to be a corporate-bond counterpart to the S&P 500, which is widely regarded as the best single gauge of large cap US equities. Floating Rate Bond Index is a rule-based, market-value weighted index engineered to measure the performance and characteristics of floating rate coupon U.S. Treasuries which have a maturity greater than 12 months.