Trend-following is essentially a “tried and true’ approach to investing. But overbought/oversold (i.e., attempting to buy low/sell high) – that’s where the “excitement” is. Of course, when it comes to trading and investing, “excitement” can be highly overrated. Nevertheless, in this piece I want to talk about a relatively obscure indicator that may be useful in identifying vastly oversold situations.
EDITORS NOTE: The AIQ EDS file for Jay Kaeppel’s indicator is available to download at
The VixRSI14 Indicator
Part of the reason this indicator is obscure is because I think I “invented” it – but only by mashing together an indicator from Larry Williams and an indicator from Welles Wilder. The first part is the standard Welles Wilder 14-day Relative Strength Index, more commonly referred to as “RSI”.
The 2nd part of VixRSI14 is an indicator created by famed trader Larry Williams which he dubbed “VixFix”. This indicator is an effort to create a “Vix Index-like” indicator for any security.
AIQ TradingExpert code for these indicators appears at the end of the article.
A Few Notes
*For the record, VixRSI14 is calculated by taking a 3-day exponential average of VixFix and dividing that by a 3-day exponential average of RSI14 (are we having fun yet?). Please see code at the end of the article.
*I prefer to use VixRSI14 using weekly data rather than daily data
*(Unfortunately) There are no “magic numbers” that indicate that a completely risk-free, you can’t lose, just buy now and watch the money roll in” buying opportunity is at hand (Disclaimer: If there was, I would probably just keep it to myself and not bother writing the article – sorry, it’s just my nature). That being said, a decent “rule of thumb” is to look for a reading above 3.5 followed by a downside reversal.
(Click any chart below to enlarge)
With those thoughts in mind, Figure 1 displays a weekly chart of Wynn Resorts (WYNN) with the two indicators plotted separately below the bar chart.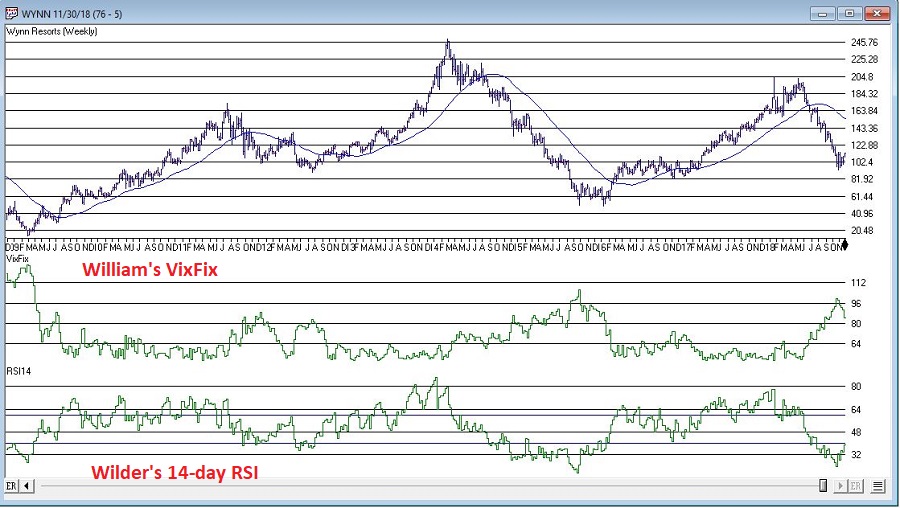
Figure 1 – WYNN with William’s VixFix and Wilder’s RSI 14-day (Courtesy AIQ TradingExpert)
Note that as price declines, VixFix tends to rise and RSI14 tends to fall. VIXRSI14 essentially identifies “extremes” in the difference between these two. Figure 2 displays WYNN with VixRSI14 plotted below the bar chart.
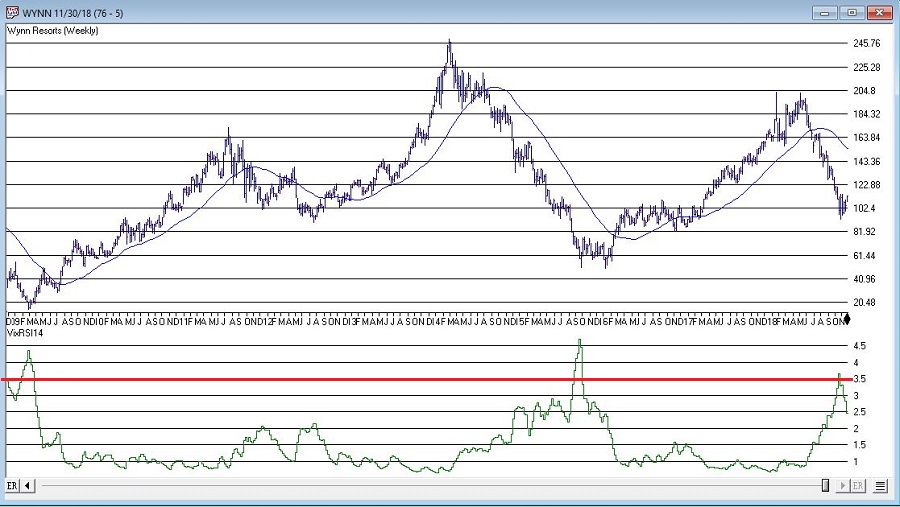
Figure 2 – WYNN with VixRSI14 (Courtesy AIQ TradingExpert)
More “examples” appear in Figures 3 through 8 below.
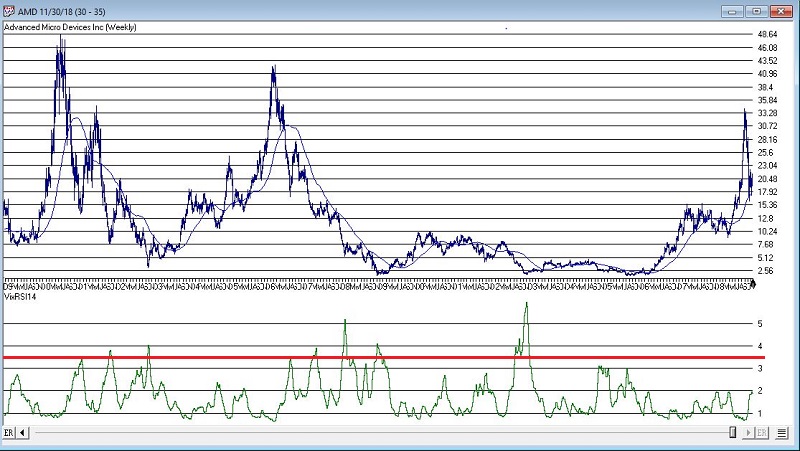
Figure 3 – AMD (Courtesy AIQ TradingExpert)
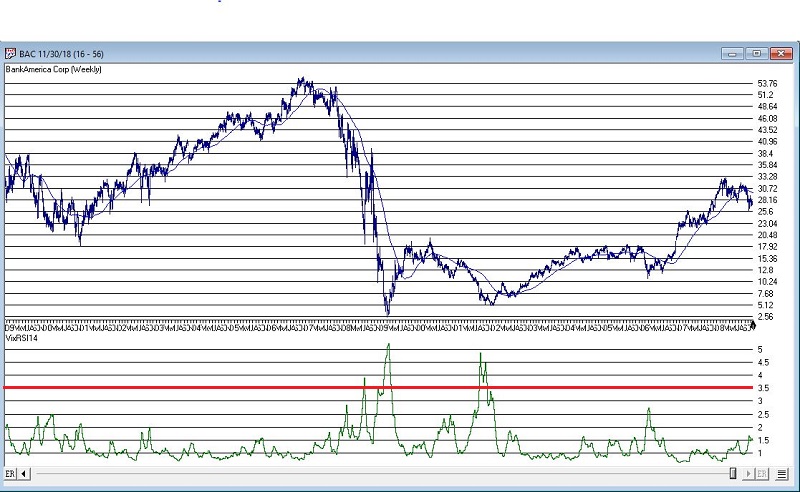
Figure 4 – BAC (Courtesy AIQ TradingExpert)
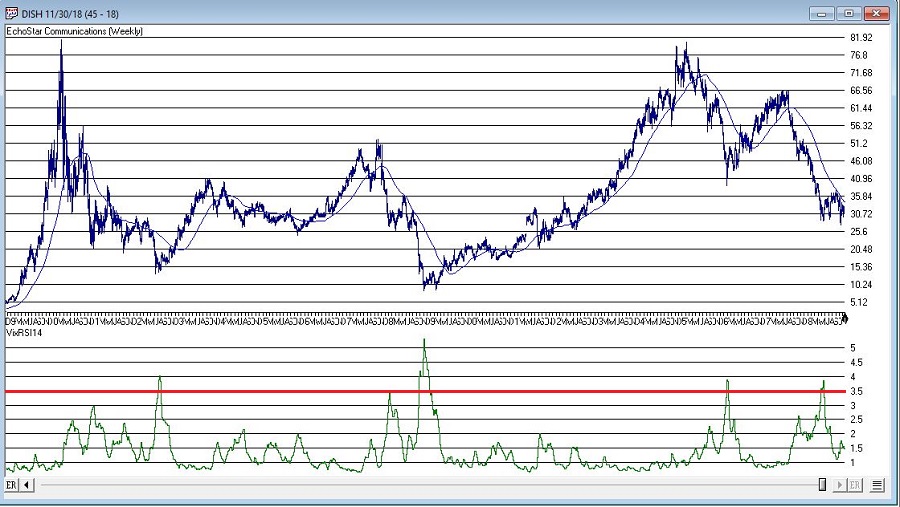
Figure 5 – DISH (Courtesy AIQ TradingExpert)
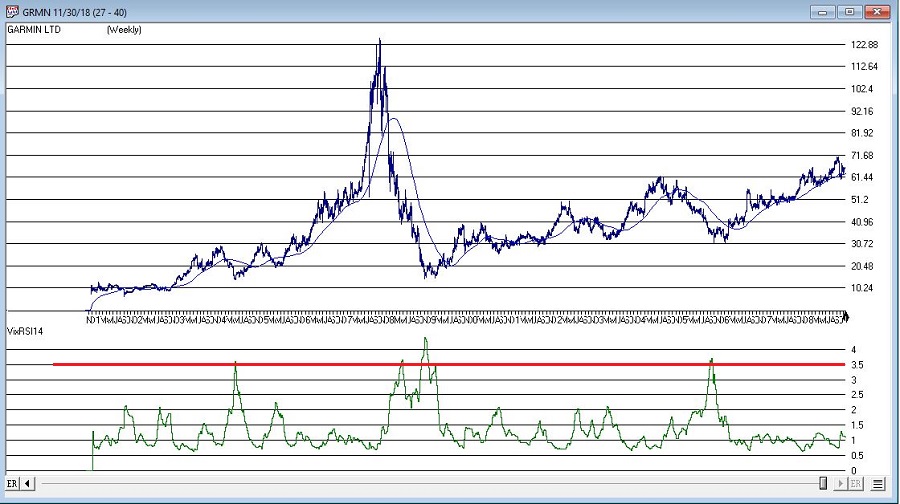
Figure 6 – GRMN (Courtesy AIQ TradingExpert)
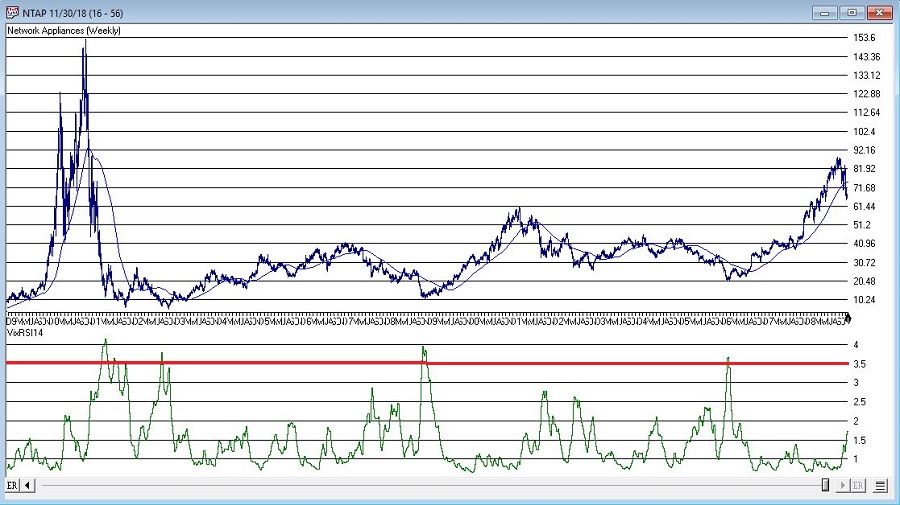
Figure 7 – NTAP (Courtesy AIQ TradingExpert)
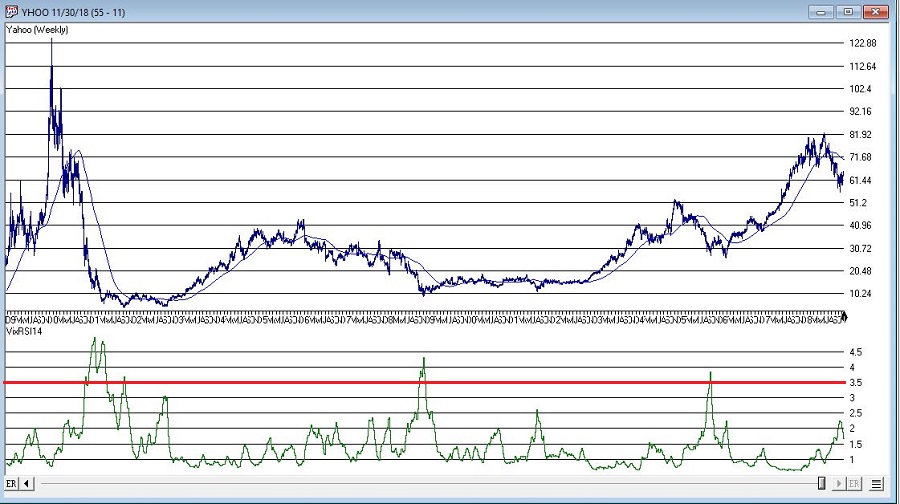
Figure 8 – YHOO (Courtesy AIQ TradingExpert)
Summary
As always, I merely present “ideas” here at JOTM. So, do not assume from the charts above that you have found the “keys to the kingdom”. But if used in conjunction with other confirming indicators – and remembering to employ some sort of risk control for those instances when a stock price decline fails to arrest itself even after VixRSI4 peaks above 3.5 – VixRSI14 may hold some value.
Indicator Code
EDITORS NOTE: The AIQ EDS file for Jay Kaeppel’s indicator is available to download at
Below is the code for VixFix, RSI14 and VixRSI14 from AIQ Expert Design Studio.
!#######################################
!VixFix indicator code
hivalclose is hival([close],22).
vixfix is (((hivalclose-[low])/hivalclose)*100)+50.
!#######################################
!#######################################
!RSI14 code
Define days14 27.
U14 is [close]-val([close],1).
D14 is val([close],1)-[close].
AvgU14 is ExpAvg(iff(U14>0,U14,0),days14).
AvgD14 is ExpAvg(iff(D14>=0,D14,0),days14).
RSI14 is 100-(100/(1+(AvgU14/AvgD14))).
!#######################################
!#######################################
!VixRSI14 code
VixRSI14 is expavg(vixfix,3)/expavg(RSI14,3).
!#######################################
Jay Kaeppel
Disclaimer: The data presented herein were obtained from various third-party sources. While I believe the data to be reliable, no representation is made as to, and no responsibility, warranty or liability is accepted for the accuracy or completeness of such information. The information, opinions and ideas expressed herein are for informational and educational purposes only and do not constitute and should not be construed as investment advice, an advertisement or offering of investment advisory services, or an offer to sell or a solicitation to buy any security.