OK, I suppose I should refer to this as “my” best bear market strategy. For the record, “the” best bear market strategy is to sell short at the top and buy back at the bottom. Which reminds me, if you possess information on how to achieve this objective please feel free to pass your contact info on to me. Barring that, what follows is a pretty decent approach to dealing with bear markets.
Also, I will grant you that this is not the most “timely” article in the world, since we are not technically now in a bear market. Still it never hurts to “be prepared”, so I want to highlight one approach to trading a bear market.
First the bad news: this method involves a fair amount of trading – at least two trades a month to be specific. While this may not be everyone’s cup of tea, ultimately – using here the ubiquitous, annoying and yet highly appropriate phrase for our times – “It is what it is.”
Jay’s Bear Market Method
There are three parts:
- The Dow versus its 200-day moving average
- Specific trading days of the month
- Market Holidays
Dow versus 200-day moving average
For our purposes we will designate the stock market as being in a bear market when the Dow Jones Industrials Average is below its 200-day moving average. To sum it up as succinctly as possible:
Dow > 200-day moving average = GOOD
Dow < 200-day moving average = BAD
One important note: For trading purposes I use a one-day lag when a crossover occurs. If the Dow closes above the 200-day MA on Monday and then closes below it on Tuesday, then in theory the market turns bearish at the close on Tuesday. However, for actual trading purposes it is pretty tough to get a trade off at the close on Tuesday when you don’t know for sure that you should until…the close on Tuesday.
So for the record, for our purposes a “bearish” period begins at the close on the day afterthe Dow first closes below its 200-day moving average. Likewise, the bearish period ends at the close one trading day after the Dow closes back above its 200-day moving average.
Trading Days of Month
When our 200-day moving average indicator above is “bearish” we designate the following trading days of the month as “bullish”
*The last 4 trading days of the month and the first 3 trading days of the next month
*Trading days #9, 10, 11 and 12
In other words, when the Dow is below its 200-day moving average we want to be long the stock market on these days
Holidays
In addition to the trading days listed above, when our 200-day moving average indicator above is “bearish” we also want to be long the stock market on the 3 trading days before and the 3 trading days after each stock market holiday (New Years, Martin Luther King Day, President’s Day, etc.)
Results
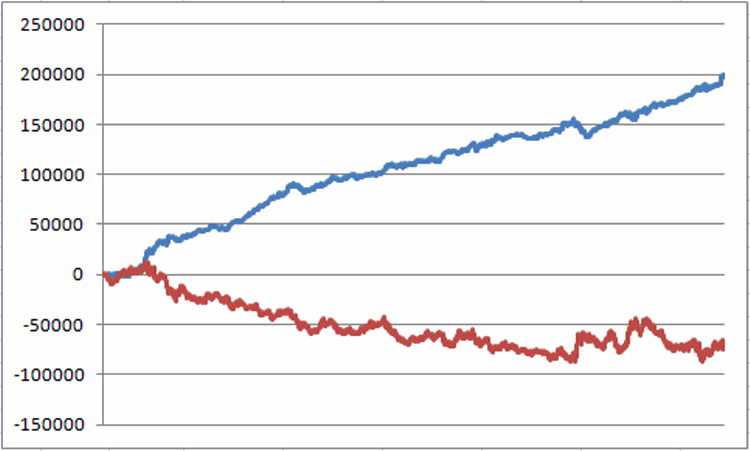
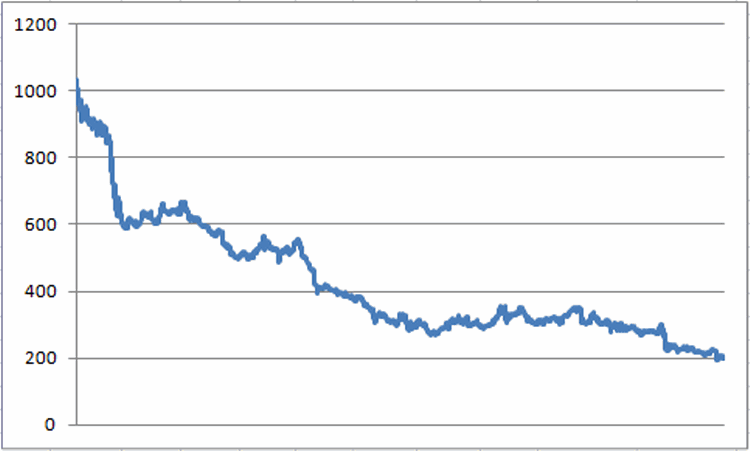
So what does all of this do for us? The results appear in Figure 1 below. To review, these results measure the growth of $1,000 invested in the Dow Jones Industrials Average only when:
*The Dow is below its 200-day moving average (with a 1-day lag following the crossover before a bearish period begins or ends)
*Today is within 3 trading days before or after a market holiday OR today is one of the last 4 trading days of the months, one of the first 3 trading days of the month or falls within trading days #9 through 12.
The blue line depicts the growth using Jay’s Bear Market Method. The red line depicts the growth from buying and holding the Dow Industrials Average while our 200-day moving average indicator is “bearish.”
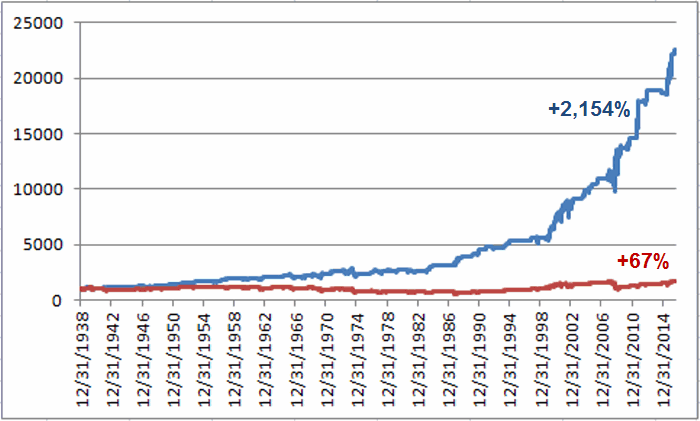
Figure 1 – Growth of $1,000 invested in Dow using Jay’s Bear Market Method (blue line) versus $1,000 invested in Dow on all days when the Dow is below its 200-day moving average* (red line); 12/31/1938-9/26/2016
* – using a 1-day lag for crossovers
For the record, since 12/31/1938:
*$1,000 invested in the Dow only when the trend is “bearish” (i.e., below the 200-day moving average with a 1-day lag on crossovers) grew to $1,675 (or+67%)
*$1,000 invested in the Dow only when Jay’s Bear Market Method is bullish grew to $22,542 (or +2,154%). Now that’s what I call “making the best of a bad situation”.
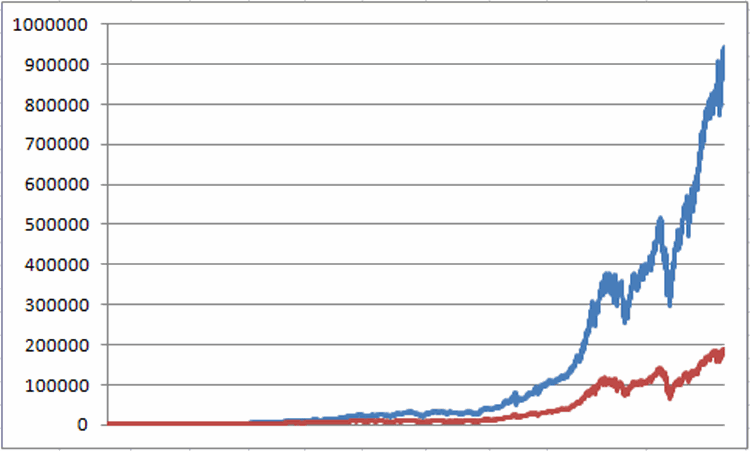
The Worst of the Worst
Figure 2 displays the performance of the Dow during the “Worst of the Worst” trading days. In this scenario:
*The Dow is below its 200-day moving average (again with a 1-day lag for crossovers)
*Today is NOT one of the trading days of the month listed above and is NOT within 3 trading days of a market holiday.
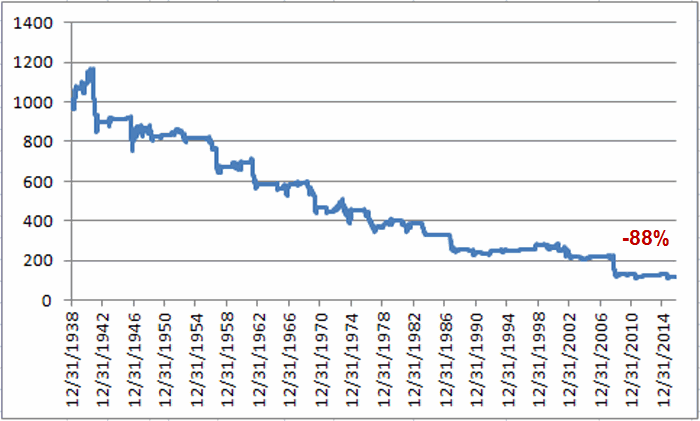
Figure 2 – Growth of $1,000 invested in Dow when Dow is below 200-day moving average AND today is NOT one of the favorable trading days listed above; 12/31/1938-9/26/2016
For the record, $1,000 invested in the Dow ONLY on these “Worst of the Worst” trading days by -88% to $114 since 1938. Now that’s what I call a bear market.
Jay Kaeppel
Chief Market Analyst at JayOnTheMarkets.com and AIQ TradingExpert Pro (http://www.aiqsystems.com) client