Everyone hates the energy sector (Foreshadowing alert: Well, almost everyone). And a quick perusal of Figure 1 clearly illustrates why the energy sector is unloved.
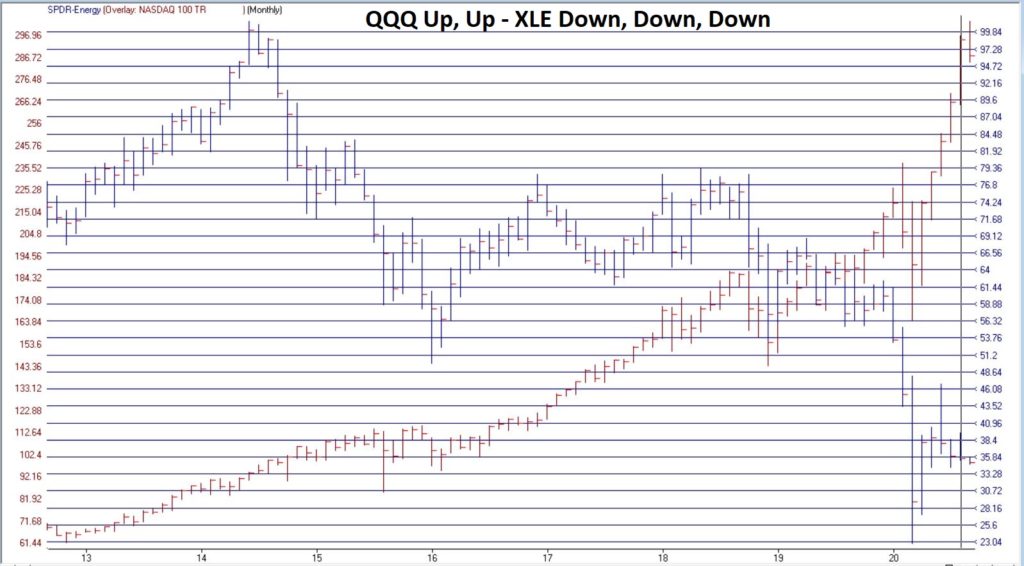
Figure 1 – Ticker XLE versus ticker QQQ (Courtesy AIQ TradingExpert)
Since ticker XLE (Energy Select Sector SPDR ETF) topped out in 2014:
*XLE has lost -65%
*QQQ has gained +210%
And in another kick in the head to the energy sector, Exxon (ticker XOM) was just kicked out of the Dow Jones Industrial Average. Take that, losers!
So yeah, who wouldn’t hate energy stocks and decide to shun them? Well, as it turns out, the answer to that question of late is “the people who know the energy business the best.”
Figure 2 from www.Sentimentrader.com displays the Insider Buy/Sell ratio for executives and other muckety-mucks running energy related corporations. The picture speaks for itself.
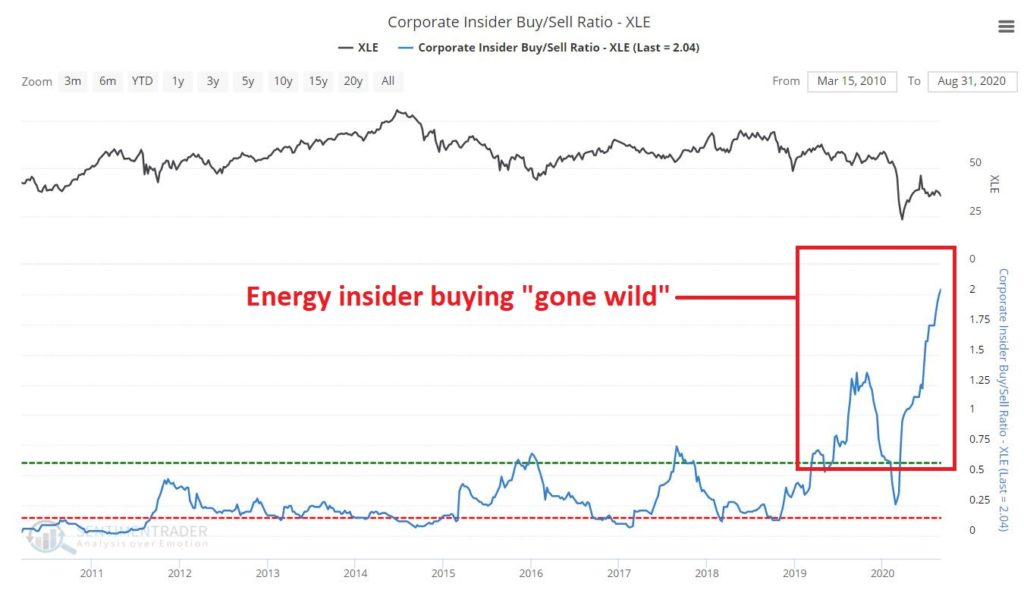
Figure 2 – Energy Insider Buy/Sell Ratio (Courtesy Sentimentrader.com)
As you can see, energy corporate insiders have been on a massive buying binge of late. Interestingly, they went on a buying binge in 2019 – apparently expecting an improvement in the sector – then the sector got waylaid by Covid-19. Instead of bailing out the insiders really kicked their share buying into overdrive as you can see at the far right of Figure 2.
Figure 3 displays ticker XLE with an indicator that I developed by simply smoothing Larry Williams VixFix indicator. The gist of the idea, is that when this indicator reaches an extreme high level and then turns down, it often highlights a “washed out” situation which may be followed by a bullish move. Ticker XLE is presently nearing that point.
EDITTORS NOTE: VixFix smoothed indicator code sections can be copied and pasted into AIQ EDS or you can download the indicator code in an EDS file from here and save it to your /wintes32/EDS Strategies folder.
This indicator is based on another indicator called VixFix which was developed many years ago by Larry Williams.
hivalclose is hival([close],22). <<<<<The high closing price in that last 22 periods
vixfix is (((hivalclose-[low])/hivalclose)*100)+50. <<<(highest closing price in last 22 periods minus current period low) divided by highest closing price in last 22 periods (then multiplied by 100 and 50 added to arrive at vixfix value)
vixfixaverage is Expavg(vixfix,3). <<< 3-period exponential average of vixfix
vixfixaverageave is Expavg(vixfixaverage,7). <<<7-period exponential average of vixfixaverage
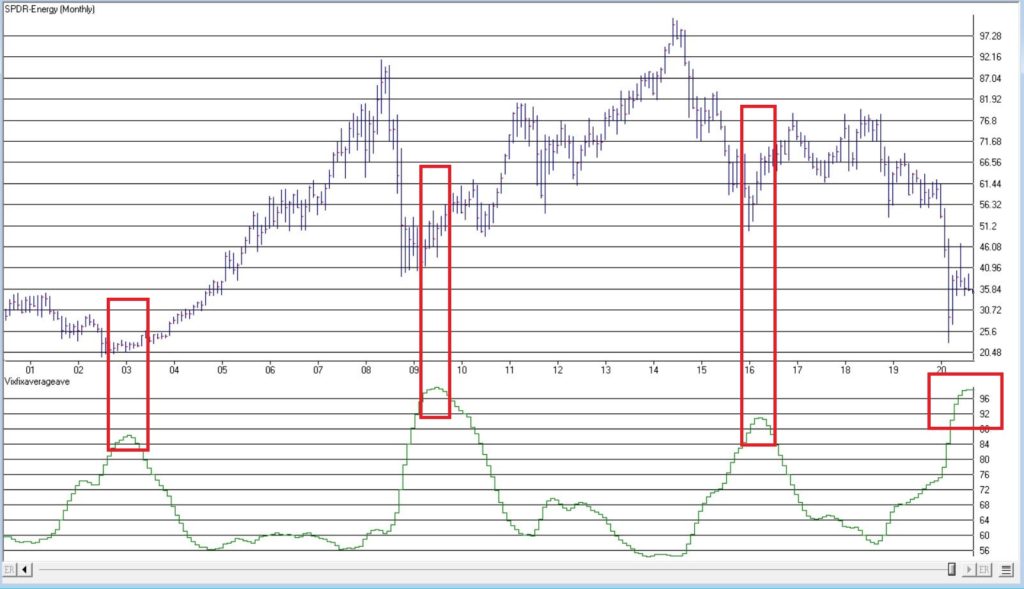
Figure 3 – Ticker XLE with oversold indicator (Courtesy AIQ TradingExpert)
What to make of all this?
Should savvy investors follow the insider’s lead and start piling into the energy sector? Unfortunately, hindsight is the only way to know for sure. But for what it is worth, my own answer is “probably, but maybe not just yet.”
Energy Seasonality
The primary reason for hesitation at this exact moment in time is seasonality. Let’s use ticker FSESX (Fidelity Select Sector Energy Services) as a proxy for the broader energy index. This fund’s first full month of trading was January 1986. Figure 4 displays the cumulative total return for ticker FSESX ONLY during the months of June through November every year since 1986.
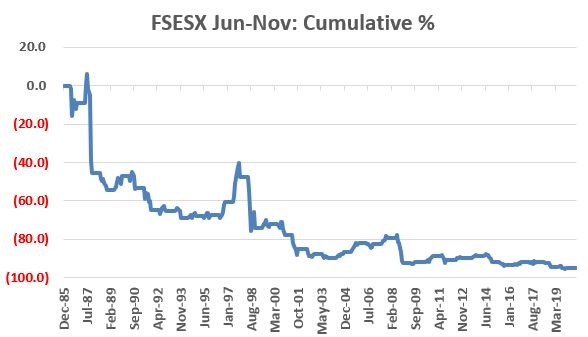
Figure 4 – FSESX cumulative % return June through October (1986-2020)
The cumulative total return during these months for holders of FSESX during June through November is -94.7%(!!!) So, you see my hesitation with “piling in”.
Additionally – climate change concerns aside – much of the energy industry still revolves around crude oil. Figure 4 displays the annual seasonal trend by month for crude oil.
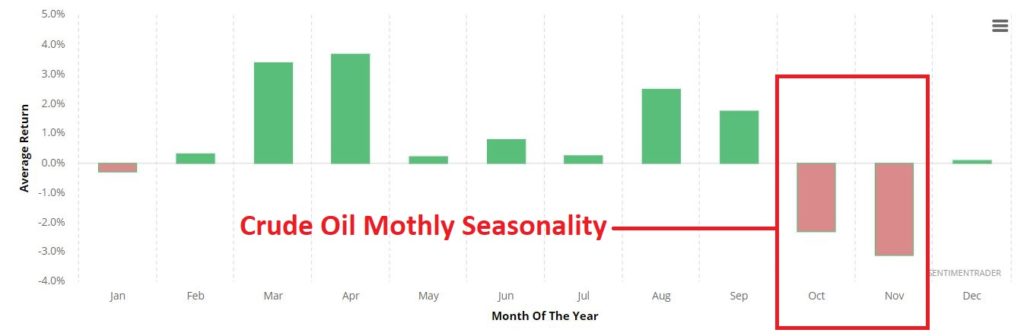
Figure 5 – Crude Oil annual seasonal trend by Month (Courtesy Sentimentrader.com)
Seasonal trends can vary widely from year-to-year, and there is NO guarantee that trouble lies ahead in Sep-Oct-Nov for the energy sector.
But that is what history suggests.
Summary
The bottom line is this:
*Energy sector corporate insider buying should be seen as a bullish longer-term sign for the sector
*The energy sector is so beaten down, battered and unloved that it probably accurate to refer to the situation as “Blood in the Streets”
Based on these factors I look for energy to surprise investors in the years ahead. That being said:
*Trying to pick the exact bottom in anything is typically a fool’s errand
*Getting bullish on the energy sector in early September is at times fraught with peril.
Sometime around December 1st it will be time to take a close look at the energy sector. If an actual uptrend develops or has already developed, the time may be write for investors to join the insiders.
Jay Kaeppel
Disclaimer: The information, opinions and ideas expressed herein are for informational and educational purposes only and are based on research conducted and presented solely by the author. The information presented represents the views of the author only and does not constitute a complete description of any investment service. In addition, nothing presented herein should be construed as investment advice, as an advertisement or offering of investment advisory services, or as an offer to sell or a solicitation to buy any security. The data presented herein were obtained from various third-party sources. While the data is believed to be reliable, no representation is made as to, and no responsibility, warranty or liability is accepted for the accuracy or completeness of such information. International investments are subject to additional risks such as currency fluctuations, political instability and the potential for illiquid markets. Past performance is no guarantee of future results. There is risk of loss in all trading. Back tested performance does not represent actual performance and should not be interpreted as an indication of such performance. Also, back tested performance results have certain inherent limitations and differs from actual performance because it is achieved with the benefit of hindsight.