August 08, 2020
Hello Everyone,
As the COVID 19 Virus bounces back from a lower number a month ago, the stock markets, especially the technology stocks continue to rise. The difference this time is that although cases are rising, the number of deaths is much less proportionately than they were just 3 to 4 months ago. The reason, now the 20 to 49-year-olds are now getting the virus, but because they are generally healthier than the 70 to 80-year-olds, they are beating the virus as their immune system is stronger. The reason the technology stocks are continuing to rally is that people are staying at home and using Apple, Google, Amazon, Tesla, Netflix, Zoon, Docusign, etc.
One somewhat concerning fact is that The Top 15 Stocks in the S&P 500 account in Market Value 35% of the entire S&P 500 stock market. The Bottom 420 Stocks in the S&P 500 account in Market Value 33.8% of the entire S&P 500 stock market. This means that 15 stocks are controlling the entire S&P 500. This troubling skewed market is again showing that a very small number of stocks are making us money and the rest are on their back
- It’s mostly technology stocks, large technology stocks. That’s it, other than some special situations. I am still positive on the stock market long term, but the large growth stocks, although still good for the longer term are now fairly valued and could have somewhat of a setback soon. The more aggressive clients are doing well as the aggressive technology stocks represent a bigger percentage of your portfolio than the bonds and dividend stocks. When the vaccine is available and people go back to work and when people feel safe to get back to some semblance of normalcy to make people want to travel, go to a local restaurant or simply to a movie, we could see these value and dividend stocks climb, but until that happens, the technology stocks will most likely dominate the stock markets.
- Take a look below, The Dow is down 3%, The Equal weighted S&P 500 is down almost 4%, but the NASDAQ is up 22% because of 15 stocks and the values of their company controlling the entire market including the regular market-weighted S&P only up 5%.
CURRENT TRENDS:
Some of the INDEXES of the markets both equities and interest rates are below. The source is Morningstar.com up until August 8, 2020. These are passive indexes.
Dow Jones -3.0%
S&P 500 +5.0%
EQUAL WEIGHTED S&P 500 -4.0%
NASDAQ Aggressive growth +22%
Large Cap Value -5.0%
I Shares Russell 2000 ETF (IWM) Small cap -9.0%
Midcap stock funds -4.7-15.76%
International Index (MSCI – EAFE ex USA -6.2%
Financial stocks -18%
Energy stocks -36.53%
Healthcare Stocks +2.8% Moderate Mutual Fund Investment Grade Bonds (AAA) Long duration +1.5%
High Yield Merrill Lynch High Yield Index -2.8% Floating Rate Bond Funds -3.4%
Short Term Bond +1.6%
Fixed Bond Yields (10 year) .85% Yield
Classicalprinicples.com and Robert Genetskis Excerpts:
Despite concerns over a weak recovery, the S&P500 reached my estimate of fair value. In contrast, the Nasdaq has far exceeded all prior measures of reasonable valuation. How can stocks rise with the economy so weak? There are two reasons. First, the economy is not weak. It continues to recover rapidly. Second, monetary policy is more expansive than at any time in history.
Although stocks are either fully-valued or over-valued, they can still go higher. At this point, I’m comfortable continuing to ride the wave higher while holding 10% cash for use when the market corrects. Stay cautiously bullish.
Friday’s employment report shows a gain of 1.5 million private-sector workers in early July. The number of unemployed remains high at 16 million. The good news is that weekly unemployment insurance claims continued to improve through the end of July.
The ISM surveys of manufacturers and service companies also show employment contracting. However, these surveys show a strong surge in new orders, which will lead to an ncrease in jobs in August. There are reasons why unemployment remains high. Given the uncertainty over the outlook, it’s natural to await new orders before hiring. Also, employers need to trim unessential costs to pay for the increased costs associated with the virus. Finally, government payments not to work have appealed to many.
Source: Classical Principles.com
S&P 500
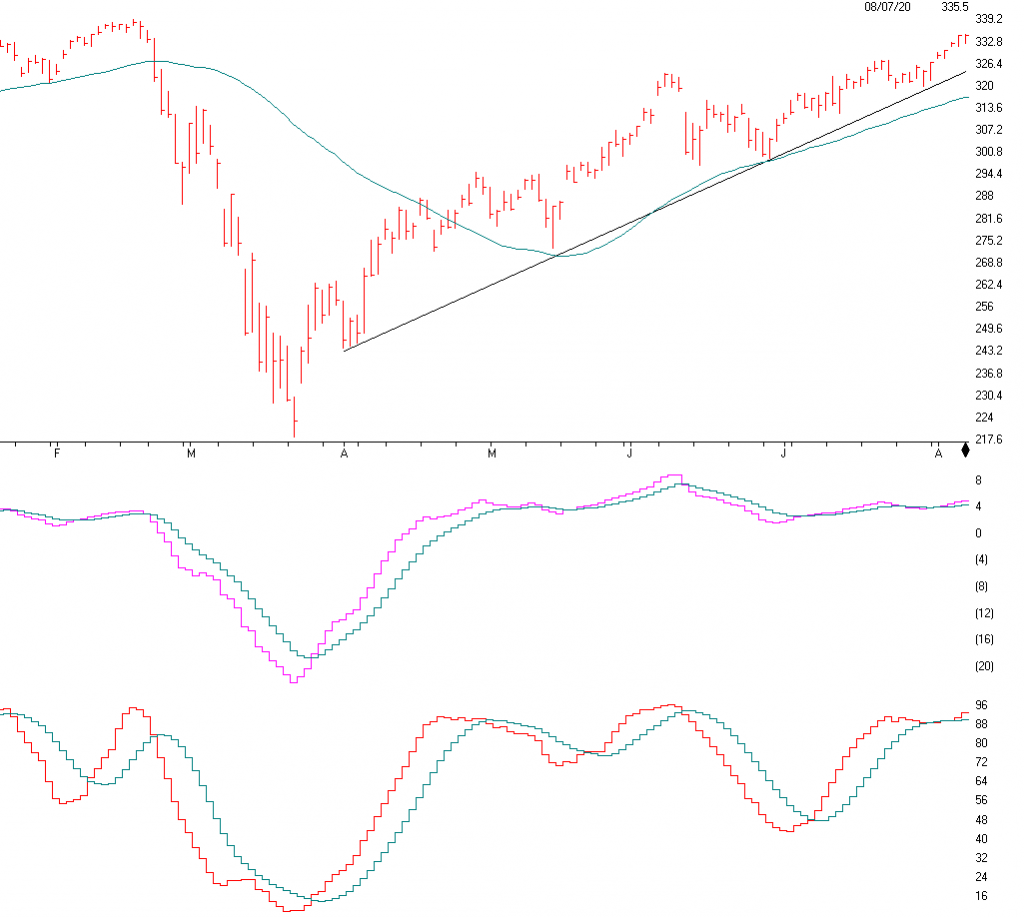
Source:AIQsystems.com
The S&P 500 chart is above. It is the Market weighted index described on the first page. Because technology is a major component of this index, stocks like Apple, Amazon, Microsoft and more are making is look
better than what the entire market is doing which is still down 4-10%+ if you look at all stocks.
I tried to make it simple see above. The 3390 area on the S&P 500 is major resistance and 3260, where the Up arrows are should act as support. Right below that is the 50 day moving average. Many traders or investors will sell if the S&P 500 drops and closes below the 50 moving average or the Trend line you see above. Many of you may want to sell if the S&P 500 drops below 3260. In addition the second graph shows the SD-SK Stochastics model as Overbought because the number is over 88. This is another overbought indicator.
Support levels on the S&P 500 area are 3328, 3264, 3150. 3390 is resistance.
▪ These may be safer areas to get into the equity markets on support levels slowly on the accumulation areas.
THE BOTTOM LINE:
The market has rebounded nicely over the last month mainly on the decline in Covid19 cases, and the economy reopening. The NASDAQ has done the best and should continue to do well IF the market continues higher, But now I am thinking that the small to midcap growth and value sector is more undervalued especially when the USA goes back to work and there is a safe and effective vaccine. The Midcap and Small caps could outperform if the rally continues from here. There is a major trend-line right below the markets, see above. If those are broken on a Close I will get Cautious
to Very Cautious. It is important for the trendlines and the 50 day moving to hold or it could start a correction. I like the USA market better than the international market, however the International Emerging markets is getting interesting.
If you have any questions, please call me at 860-940-7020.
Best to all of you,
Joe
Joe Bartosiewicz, CFP®
Investment Advisor Representative
Securities and advisory services offered through SagePoint Financial, Inc. (SPF), member FINRA/SIPC. SPF is separately owned and other entities and/or marketing names, products or services referenced here are
independent of SPF. 800-552-3319 20 East Thomas Road Ste 2000 Phoenix AZ 85012
Charts provided by AIQ Systems:
Technical Analysis is based on a study of historical price movements and past trend patterns. There is no assurance that these market changes or trends can or will be duplicated shortly. It logically follows that historical precedent does not guarantee future results. Conclusions expressed in the Technical Analysis section are personal opinions: and may not be construed as recommendations to buy or sell anything.
Disclaimer: The views expressed are not necessarily the view of Sage Point Financial, Inc. and should not be interpreted directly or indirectly as an offer to buy or sell any securities mentioned herein. Securities and Advisory services offered through Sage Point Financial Inc., Member FINRA/SIPC, an SEC-registered investment advisor.
Past performance cannot guarantee future results. Investing involves risk, including the potential loss of principal. No investment strategy can guarantee a profit or protect against loss in periods of declining values. Please note that individual situations can vary. Therefore, the information presented in this letter should only be relied upon when coordinated with individual professional advice. *There is no guarantee that a diversified portfolio will outperform a non-diversified portfolio in any given market environment. No investment strategy, such as asset allocation, can guarantee a profit or protect against loss in periods of declining values.
It is our goal to help investors by identifying changing market conditions. However, investors should be aware that no investment advisor can accurately predict all of the changes that may occur in the market. The price of commodities is subject to substantial price fluctuations of short periods and may be affected by unpredictable international monetary and political policies. The market for commodities is widely unregulated, and concentrated investing may lead to Sector investing may involve a greater degree of risk than investments with broader diversification. Indexes cannot be invested indirectly, are unmanaged, and do not incur management fees, costs, and expenses.
Dow Jones Industrial Average: A weighted price average of 30 significant stocks traded on the New York Stock Exchange and the NASDAQ.
S&P 500: The S&P 500 is an unmanaged indexed comprised of 500 widely held securities considered to be representative of the stock market in general.
NASDAQ: the NASDAQ Composite Index is an unmanaged, market-weighted index of all over the counter common stocks traded on the National Association of Securities Dealers Automated Quotation System
(IWM) I Shares Russell 2000 ETF: Which tracks the Russell 2000 index: which measures the performance of the small capitalization sector of the U.S. equity market. A Moderate Mutual Fund risk mutual has approximately 50-70% of its portfolio in different equities, from growth, income stocks, international and emerging markets stocks to 30-
50% of its portfolio in different categories of bonds and cash. It seeks capital appreciation with a low to moderate level of current income.
The Merrill Lynch High Yield Master Index: A broad-based measure of the performance of non-investment grade US Bonds MSCI EAFE: the MSCI EAFE Index (Morgan Stanley Capital International Europe, Australia, and Far East Index) is a widely recognized benchmark of non-US markets. It is an unmanaged index composed of a sample of companies’ representative of the market structure of 20 European and Pacific Basin countries and includes reinvestment of all dividends. Investment grade bond index: The S&P 500 Investment-grade corporate bond index, a sub-index of the S&P 500 Bond Index, seeks to measure the performance of the US corporate
debt issued by constituents in the S&P 500 with an investment-grade rating. The S&P 500 Bond index is designed to be a corporate-bond counterpart to the S&P 500, which is widely regarded as the best single gauge of large-cap US equities. Floating Rate Bond Index is a rule-based, market-value weighted index engineered to measure the performance and characteristics of floating-rate coupon U.S. Treasuries, which have a maturity greater than 12 months.
Money Flow; The Money Flow Index (MFI) is a momentum indicator that measures the flow of money into and out of a security over a specified period. It is related to the Relative Strength Index (RSI) but incorporates volume, whereas the RSI only considers SK-SD Stochastics. When an oversold stochastic moves up through its MA, a buy signal is produced. Furthermore, Lane recommends that the stochastic line be smoothed twice with three-period simple moving averages: SK is the three-period simple moving average of K, and SD is the three-period simple moving average of SK Rising Wedge; A rising wedge is a technical indicator, suggesting a reversal pattern frequently seen in bear markets. This pattern shows up in charts when the price moves upward with pivot highs and lows converging toward a single point known as the apex