*”Every situation in life represents an opportunity”
*”Opportunity is where you find it”
Nowhere is this truer than in the financial markets.
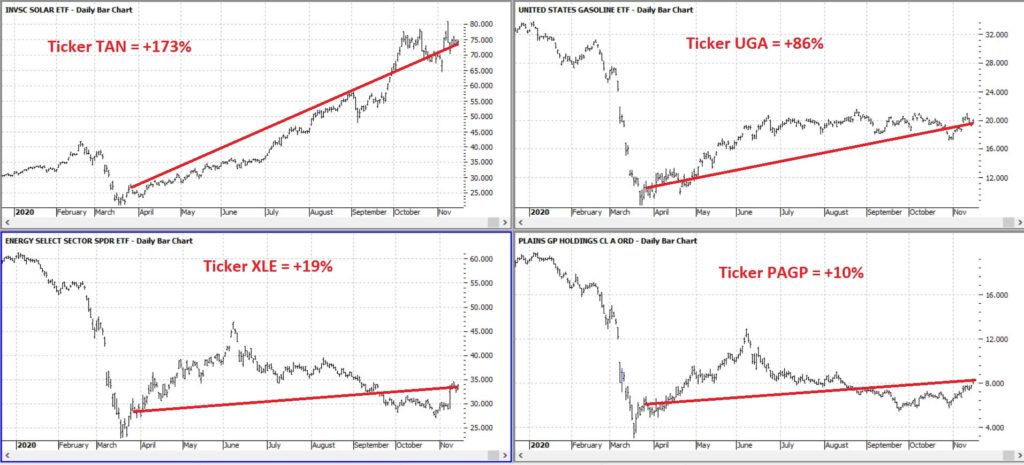
To wit, in this article dated 3/26/2020 (cue the scary music) – when things looked their absolute worst – I highlighted four tickers in the energy sector (yes, THAT energy sector, the one that has been a disaster and loathed and unloved for some time now). Now it would have taken a true “Buy when there is blood in the streets” mentality, and/or almost foolhardy nerves of steel to actually pile into those issues at the time.
But that is sort of the point.
Figure 1 displays the tickers and their price action since the close on 3/26/2020.
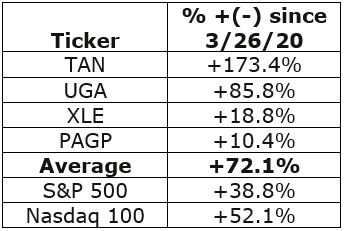
Figure 2 displays the comparative performance versus the S&P 500 and the Nasdaq 100.
Figure 2 – “Blood in the Streets” energy stocks versus major indexes
As you can see in Figure 2 these four stocks as a whole have actually outperformed both the S&P 500 Index and the Nasdaq 100 Index.
Now the point IS NOT that I am some great stock-picker (because I am not). The point is that, well, see the two quotes above.
A Broader Look at Energy
For someone with less of the “buy when there is blood in the streets” mentality and more of “trend-following” mentality, a simple trend-following method may soon (at long last) swing to the bullish side.
It works like this:
*Two “tickers” see their respective 5-week average cross above their respective 30-week average
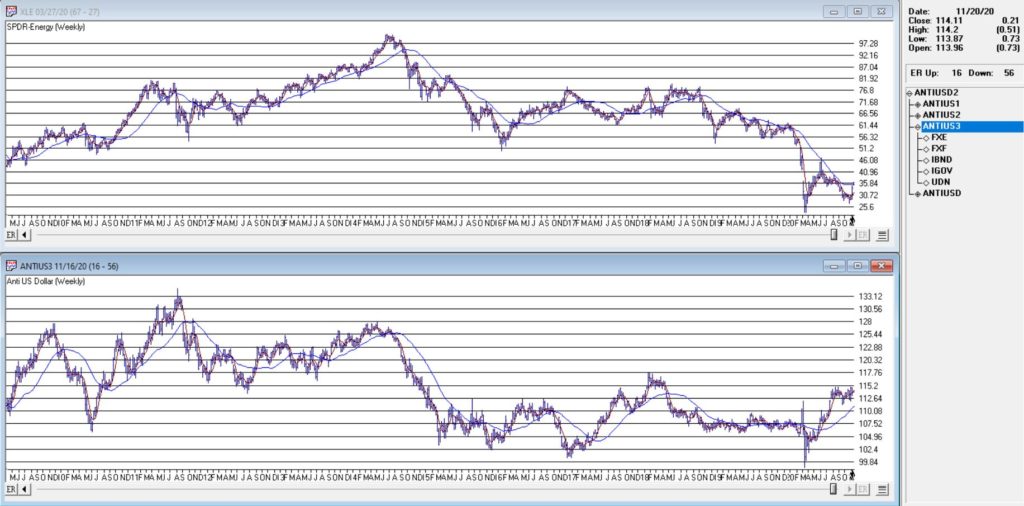
*Ticker 1 is ticker XLE (the SPDR energy ETF)
*Ticker 2 is an index (I created) of securities that have an inverse correlation to the U.S. Dollar
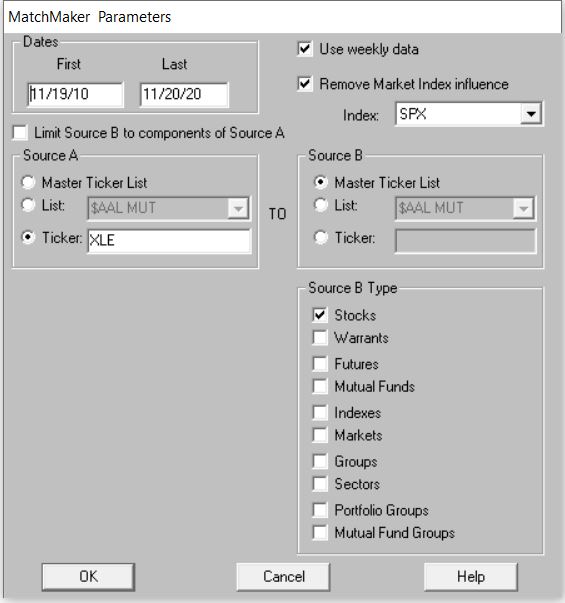
Editors Note: To create an inverse index of the ticker XLE, you’ll first need to use the Matchmaker tool and run a correlation between XLE and your database of stocks. The stocks that correlate the least with have the highest negative correlation.
To create the index. Make a new list in AIQ Data Manager, create a new group ticker called ANTIUS3 and add it to the list. Add the least correlated tickers from Matchmaker to this group, then use Compute Group/Sector Indices to compute all dates for this list. You’ll now have an equivalent to the ANTIUS3.
You can see these two – along with their respective 5-week and 30-week – in Figure 3.
As you can see in Figure 3 the two have a tendency to often move together. At other times they do not. The key point here is that we ONLY pay attention when the two tickers are both trending in the same direction.
Why is this important?
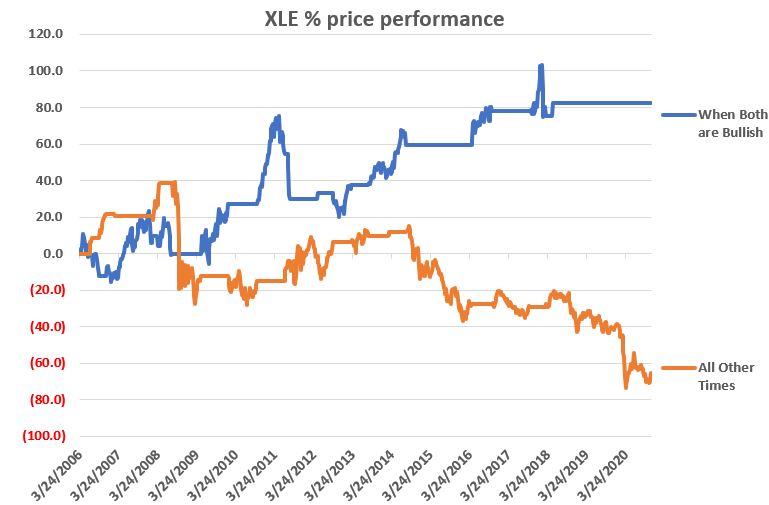
Figure 4 displays the cumulative price growth for ticker XLE (as a proxy for the broad energy sector) under two separate circumstance:
*When BOTH XLE and ANTIUS3 are in uptrends (i.e., 5-week average ABOVE 30-week average)
*When EITHER XLE or ANTIUS3 is NOT in an uptrend (i.e., 5-week average BELOW 30-week average)
Figure 4 – XLE cumulative %+(-) depending on trend status for XLE and ANTIUS3
To put it in numbers:
When BOTH are in Uptrends: XLE = +82.3%
When EITHER is NOT in an Uptrend: XLE = -65.5%
Summary
Another glance at Figure 1 reveals that ANTIUS3 is in an uptrend and that XLE is not quite there yet. So, at the moment there is no bullish signal from the method described above. However, energy does appear to be “trying” to rally. Investors looking for “opportunity” may be wise to keep an eye on the 5-week and 30-week averages of ticker XLE in the weeks and month ahead.
See also Jay Kaeppel Interview in July 2020 issue of Technical Analysis of Stocks and Commodities magazine
Disclaimer: The information, opinions and ideas expressed herein are for informational and educational purposes only and are based on research conducted and presented solely by the author. The information presented represents the views of the author only and does not constitute a complete description of any investment service. In addition, nothing presented herein should be construed as investment advice, as an advertisement or offering of investment advisory services, or as an offer to sell or a solicitation to buy any security. The data presented herein were obtained from various third-party sources. While the data is believed to be reliable, no representation is made as to, and no responsibility, warranty or liability is accepted for the accuracy or completeness of such information. International investments are subject to additional risks such as currency fluctuations, political instability and the potential for illiquid markets. Past performance is no guarantee of future results. There is risk of loss in all trading. Back tested performance does not represent actual performance and should not be interpreted as an indication of such performance. Also, back tested performance results have certain inherent limitations and differs from actual performance because it is achieved with the benefit of hindsight.
Well, the election is over and and if Trump doesn’t win the contested vote then Biden is President. My biggest concern going forward is the race in Georgia that could switch the control of the senate to the Democrats enabling them unchecked control in the government. If this happens, and Democrats get rid of the filibuster rule there could be volatily in the stock and bond markets because: It could increase taxes on corporations, raise capital gains taxes and estate taxes by reducing the couple estate tax exclusion from $11 million to $3.5 milllion.
If the Democrats don’t win then there will be gridlock, and gridlock meaning that many of the tax increases may not pass. We will see what happens on January 5th 2021. Currently my Technical Analysis computer is still on a Buy-Hold as of about a week to 2 weeks ago, but it changes daily.
The increases in the Covid 19 virus is again causing Governors in many states to restrict access to non-essential business. This will reduce earnings of many corporations but increase the earnings of technology companies that are benefitting by people using their goods and services from home. Once a safe and effective vaccine is created by either Pfizer or Moderna, and when people feel safe to travel/use the goods and services of non essential companies will they prevail. then the Value stocks, eg., the cruise lines, airlines, resorts, restaurants, retail, manufacturing, telecommunications and more should rise. Until that time, the market will be volatile.
We are now in a seasonally strong time for the stock markets, but with the overhang of the senate election in Georgia, and the increase in Covid 19 coupled with the upcoming Flu season, caution is still somewhat appropriate. For people who are more Cautious in general, but over the next 1-2 years I still think the market could go higher even though the market is about 6% overvalued mostly because of the technology stocks. When the pandemic is even close to nearing its conclusion, the Value sector should continue its rise. So, small, mid and large value stocks could be the bigger winner, and if we get a selloff because of Covid 19, I will be buying those sectors.
Some of the INDEXES of the markets both equities and interest rates are below. The source is Morningstar.com up until Novemeber 14, 2020. These are passive indexes.
Dow Jones +5.1% S&P 500 +12.2% EQUAL WEIGHTED S&P 500 +3.1% NASDAQ Aggressive growth +29% Large Cap Value -3.0% I Shares Russell 2000 ETF (IWM) Small cap +5.2% Midcap stock funds -4.66 International Index (MSCI – EAFE ex USA +2% Financial stocks -10% Energy stocks -36% Healthcare Stocks +11%
Moderate Mutual Fund Investment Grade Bonds (AAA) Long duration +6.5% igh Yield Merrill Lynch High Yield Index +1.9%
Floating Rate Bond Funds -.60% Short Term Bond +1.6% Mutli sector bond funds +2.3%
I do expect potential major volatility over the next few months if the Republicans lose the Senate.
Classicalprinicples.com and Robert Genetskis Excerpts
Market Outlook
Stocks were mixed this past week. The previously out-of-favor small caps rose 3%-4%, when the Nasdaq and QQQs fell 2%-3%. The Dow and S&P500 gained 1%-2%. I expect stocks to continue to consolidate within the range of the past five months. Biden’s choice of advisors is interesting. His Chief of Staff was the one in charge of fighting Ebola. He admitted they had made every mistake imaginable in that fight. Another medical advisor says the country should lock down for 4-6 weeks and can simply pay workers and businesses for lost income. Just what Biden needs… another advisor with no concept of economics feeding him mush. It’s important to pay attention to Biden’s advisors. Their ideas can provide a clue to just how crazy things can get. Hopefully, cooler heads will prevent the chaos that would result from such complete nonsense.
A Look Back
The latest weekly data show the labor market continues to improve in spite of Covid. Initial unemployment claims fell to 709,000 in the first week of this month. This is down about 140,000 from the previous month. For the final week in October, the insured unemployment rate fell to 4.6%, down from 7.5% from the previous month. The number of people receiving insured unemployment payments fell to 6.8 million. There were close to 11 million a month ago.
What to expect this coming week
Look for the economic numbers to continue to show the economy performing well. Tuesday’s report for manufacturing in October should be a strong one. Business surveys show manufacturing production increasing dramatically in October. Hence, the Fed’s manufacturing number should be up substantially.
Source: Classical Principles.com
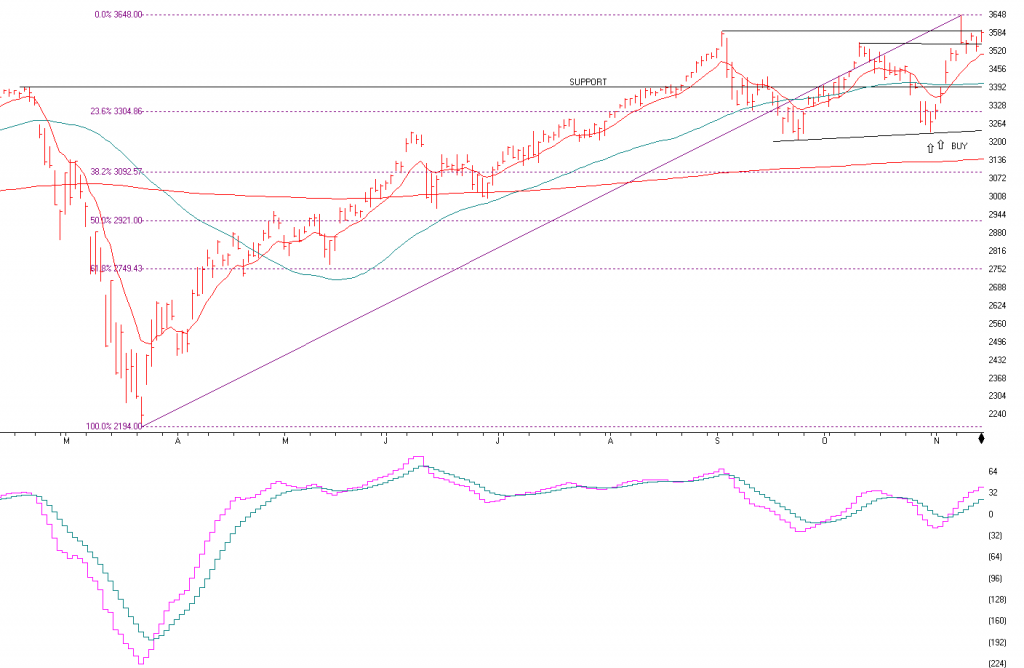
S&P 500 Chart Source: AIQsystems.com
The S&P 500 is above. As you can see my computer models gave a BUY signal on 10/30/20 and another one a couple days later. Another Bullish sign is when it broke above the middle of the W pattern. This is BULLISH unless it breaks down below that breakout. Now it has to breakout from the old high of 3648. If it does with conviction volume watch the 3750 area for some resistance. But it has to breakout from 3648 with a lot of volume first.
We are now in a bullish seasonal pattern for the market. One year from now I think the economy will do much better than it is now and the markets should be higher as well.
MACD or Momentum is still Bullish as the pink line has broken out of the blue line showing positive momentum.
Support levels on the S&P 500 area are 3546, 3392-3405, 3306 and 3244. 3143 is 200 Day Moving average NASDAQ Support, 11621, 11300-11360, 11062. Resistance is 12075 These may be safer areas to get into the equity markets on support levels slowly on the accumulation areas.
THE BOTTOM LINE:
The market has rebounded nicely over the last month mainly because of earnings of companies beating expectations. The NASDAQ has done the best this year and should continue to do well IF the market continues higher. Now that the vaccine is a reality the value stocks should start to rise. You may want to call me to review everything including your 401(k) to determine the best allocation going forward. I like the USA market better than the international market.
Best to all of you,
Joe Bartosiewicz, CFP® Investment Advisor Representative
92 High Street
Thomaston, CT 06787
860-940-7020
Securities and advisory services offered through SagePoint Financial, Inc. (SPF), member FINRA/SIPC. SPF is separately owned and other entities and/or marketing names, products or services referenced here are independent of SPF. 800-552-3319 20 East Thomas Road Ste 2000 Phoenix AZ 85012
Charts provided by AIQ Systems:
Technical Analysis is based on a study of historical price movements and past trend patterns. There is no assurance that these market changes or trends can or will be duplicated shortly. It logically follows that historical precedent does not guarantee future results. Conclusions expressed in the Technical Analysis section are personal opinions: and may not be construed as recommendations to buy or sell anything.
Disclaimer: The views expressed are not necessarily the view of Sage Point Financial, Inc. and should not be interpreted directly or indirectly as an offer to buy or sell any securities mentioned herein. Securities and Advisory services offered through Sage Point Financial Inc., Member FINRA/SIPC, an SEC-registered investment advisor.
Past performance cannot guarantee future results. Investing involves risk, including the potential loss of principal. No investment strategy can guarantee a profit or protect against loss in periods of declining values. Please note that individual situations can vary. Therefore, the information presented in this letter should only be relied upon when coordinated with individual professional advice. *There is no guarantee that a diversified portfolio will outperform a non-diversified portfolio in any given market environment. No investment strategy, such as asset allocation, can guarantee a profit or protect against loss in periods of declining values. It is our goal to help investors by identifying changing market conditions. However, investors should be aware that no investment advisor can accurately predict all of the changes that may occur in the market.
The price of commodities is subject to substantial price fluctuations of short periods and may be affected by unpredictable international monetary and political policies. The market for commodities is widely unregulated, and concentrated investing may lead to Sector investing may involve a greater degree of risk than investments with broader diversification.
Indexes cannot be invested indirectly, are unmanaged, and do not incur management fees, costs, and expenses.
Dow Jones Industrial Average: A weighted price average of 30 significant stocks traded on the New York Stock Exchange and the NASDAQ.
S&P 500: The S&P 500 is an unmanaged indexed comprised of 500 widely held securities considered to be representative of the stock market in general.
NASDAQ: the NASDAQ Composite Index is an unmanaged, market-weighted index of all over the counter common stocks traded on the National Association of Securities Dealers Automated Quotation System
(IWM) I Shares Russell 2000 ETF: Which tracks the Russell 2000 index: which measures the performance of the small capitalization sector of the U.S. equity market.
A Moderate Mutual Fund risk mutual has approximately 50-70% of its portfolio in different equities, from growth, income stocks, international and emerging markets stocks to 30-50% of its portfolio in different categories of bonds and cash. It seeks capital appreciation with a low to moderate level of current income.
The Merrill Lynch High Yield Master Index: A broad-based measure of the performance of non-investment grade US Bonds
MSCI EAFE: the MSCI EAFE Index (Morgan Stanley Capital International Europe, Australia, and Far East Index) is a widely recognized benchmark of non-US markets. It is an unmanaged index composed of a sample of companies’ representative of the market structure of 20 European and Pacific Basin countries and includes reinvestment of all dividends.
Investment grade bond index: The S&P 500 Investment-grade corporate bond index, a sub-index of the S&P 500 Bond Index, seeks to measure the performance of the US corporate debt issued by constituents in the S&P 500 with an investment-grade rating. The S&P 500 Bond index is designed to be a corporate-bond counterpart to the S&P 500, which is widely regarded as the best single gauge of large-cap US equities.
Floating Rate Bond Index is a rule-based, market-value weighted index engineered to measure the performance and characteristics of floating-rate coupon U.S. Treasuries, which have a maturity greater than 12 months.
In the late 1980’s, Japan seemed destined to “rule the financial world”. But when it comes to the financial markets – things don’t always pan out as they appear destined to. The Nikkei Index topped out in late 1989, didn’t bottom out until February 2009 and has yet to return to its 1989 peak.
But it sure is trying. This past week the Nikkei reached its highest level 1991. So, hooray for the Japanese. Back here in the US of A there may be a slightly different take. For as we will discuss in a moment, what is good for Japanese stocks is (apparently) bad for US bonds.
Ticker EWJ
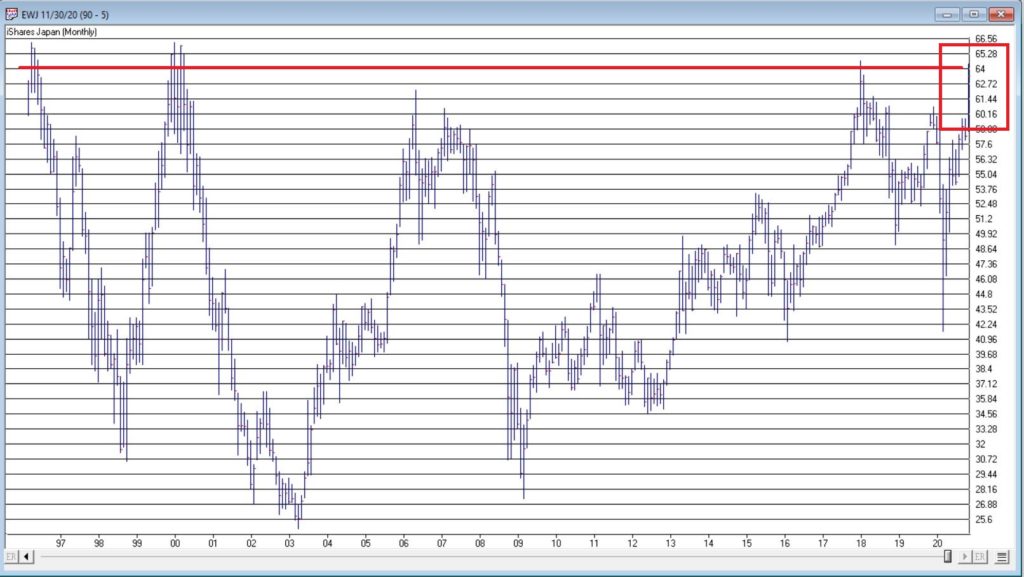
As our proxy for Japanese stocks we will use ticker EWJ (iShares Japan). In Figure 1 you can the monthly action since the ETF started trading in 1996.
Since 1996 EWJ has broken in the $60 a share range on 5 previous occasions, only to be rebuffed. You can see the latest upward thrust at the far right. Will this be the time it breaks through? It beats me and in fact that is not really the focus of this article. The real question posed here is “what about U.S. treasury bonds?” Huh? Consider Figure 2.
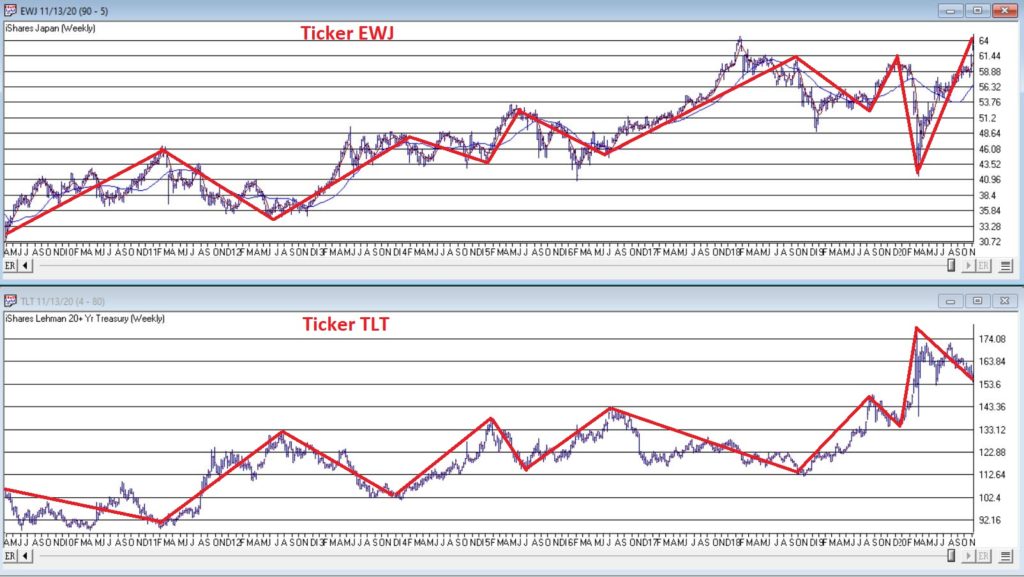
The top clip of Figure 2 displays a weekly chart of EWJ with a 5-week and 30-week moving average drawn. The bottom clip displays a weekly chart of ticker TLT – the iShares ETF that tracks the long-term U.S. treasury bond.
Note that – using highly technical terms – when one “zigs”, the other “zags.”
The thing to note is the inverse correlation between the two – i.e., when Japanese stocks advance, US treasuries tend to decline and vice versa. For the record (and for you fellow numbers geeks out there) the correlation coefficient in the last 2 years is -0.45 (1 means they trade exactly the same, -1 means they trade exactly inversely).
For my purposes:
*EWJ 5-week MA < EWJ 3-week MA = BULLISH for US treasuries
*EWJ 5-week MA > EWJ 3-week MA = BEARISH for US treasuries
Any real merit to this?
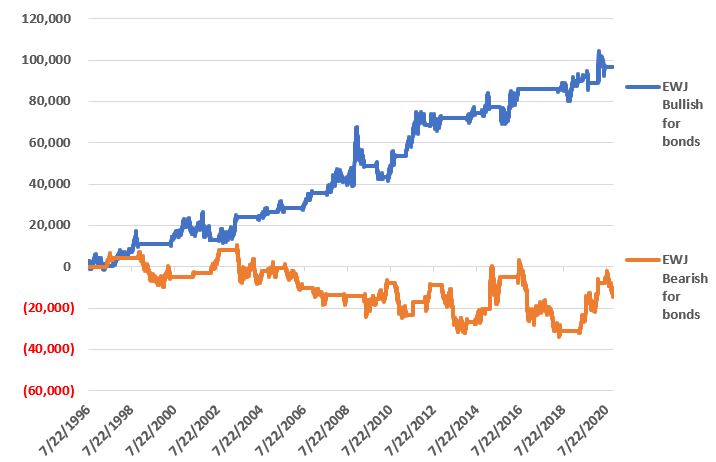
*The blue line in Figure 3 displays the cumulative $ +(-) achieved by holding a long position in t-bond futures ($1,000 a point) when the EWJ indicator is BULLISH (for U.S. bonds)
*The orange line in Figure 3 displays the cumulative $ +(-) achieved by holding a long position in t-bond futures ($1,000 a point) when the EWJ indicator is BEARISH (for U.S. bonds)
Figure 3 – $ + (-) for Treasury Bond Futures when EWJ indicator is BULLISH for bonds (blue) or BEARISH for bonds (orange)
Summary
Bond investors might keep a close eye on Japanese stocks for a while. If the latest thrust higher follows through and becomes the move that finally breaks out to the upside, the implication would appear to be negative for U.S. long-term treasury bonds. On the flip side, if Japanese stocks fail once again to break through and reverse to the downside, then things might look a whole lot better for the 30-year US treasury.
Jay Kaeppel
Disclaimer: The information, opinions and ideas expressed herein are for informational and educational purposes only and are based on research conducted and presented solely by the author. The information presented represents the views of the author only and does not constitute a complete description of any investment service. In addition, nothing presented herein should be construed as investment advice, as an advertisement or offering of investment advisory services, or as an offer to sell or a solicitation to buy any security. The data presented herein were obtained from various third-party sources. While the data is believed to be reliable, no representation is made as to, and no responsibility, warranty or liability is accepted for the accuracy or completeness of such information. International investments are subject to additional risks such as currency fluctuations, political instability and the potential for illiquid markets. Past performance is no guarantee of future results. There is risk of loss in all trading. Back tested performance does not represent actual performance and should not be interpreted as an indication of such performance. Also, back tested performance results have certain inherent limitations and differs from actual performance because it is achieved with the benefit of hindsight.
It’s been a couple of months since we last looked at the Market Timing AI Expert System. Since that time the 400 rules that make up this AI system have generated a cluster of 3 down signals, followed by a buy signal and then most recently another down signal.
In this 7 minute video Steve Hill, CEO of AIQ Systems explores the signals and the confirmation techniques used to verfiy the ratings, together with the primary rules that fired.
For the record, I am an avowed “trend-follower.” But I also know that no trend lasts forever. So, while I have gotten pretty good at “riding along”, I do – like most people – like to “look ahead” since I do know that the landscape will forever be changing.
So, with the caveat that none of what follows should be considered a “call to action”, only as a “call to pay attention”, let’s venture out “into the weeds.”
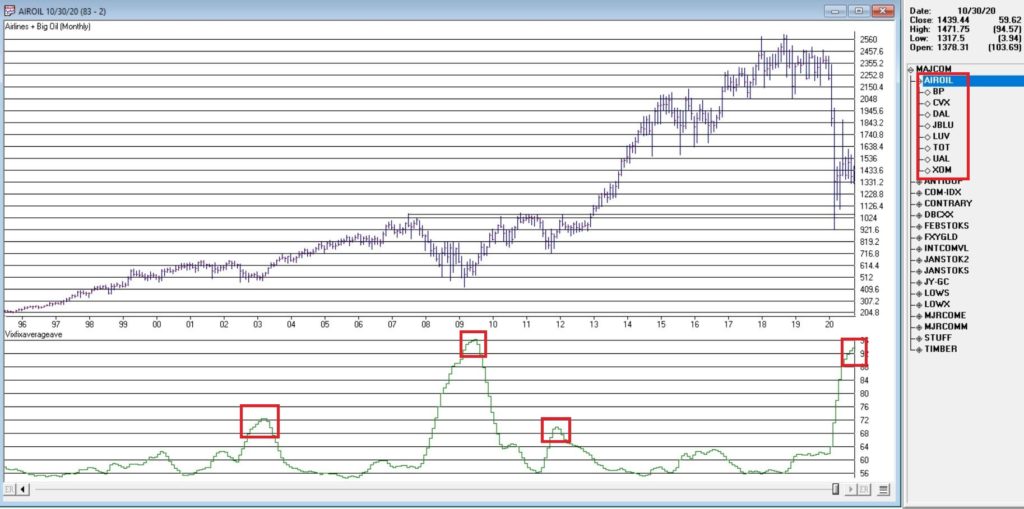
AIROIL
Here is an ugly pairing – airline stocks and traditional energy stocks – yikes! In Figure 1 you see an index that I created and followed call AIROIL comprised of three airline stocks and five “Big Oil” stocks. During the pandemic meltdown this index fell to a level not seen since 2007 before “bouncing”.
Editors Note:
Jay's AIROIL Index is built using the AIQ Data Manager by creating a list andcreating a group ticker (in this case AIROIL). Stocks are inserted under the ticker and the index is then computed using Compute Group/Sector indices.
In the bottom clip you see an indicator I call VFAA. Note that when VFAA tops out and rolls over, meaningful advances in the index tend to follow. In addition, VFAA is at a high level seen only once before in 2009. Following that reversal, the index rose almost 500% over the next 9 years.
So, is now a great time to pile into airlines and big oil? One would have to be a pretty hard-core contrarian to pound the table on this one. The airlines are in terrible shape due to the pandemic and vast uncertainty remains regarding when things might improve. And “Big Oil” is about as unloved as any sector has ever been.
So, am I suggesting anyone “load up” on airlines and oil? Nope. What I am saying is that I am watching this closely and that if and when VFAA “rolls over” I may look to commit some money to these sectors on a longer-term contrarian basis.
International/Commodities/Value
Also known of late as “the barking dogs”. If you have had money committed to any or all of these asset classes in recent years you are shaking your head right about now. These areas have VASTLY underperformed a simple “buy-and-hold the S&P 500 Index” approach for a number of years.
Is this state of affairs going to change anytime soon? Regarding “anytime soon” – it beats me. However, I am on the record as arguing that at some point this WILL change. History makes one thing very clear – no asset class has a permanent edge. So, given that the S&P 500 Index has beaten these above mentioned by such a wide margin for such a long time (roughly a decade or more) I am confident that one day in the next x years, the “worm will turn.”
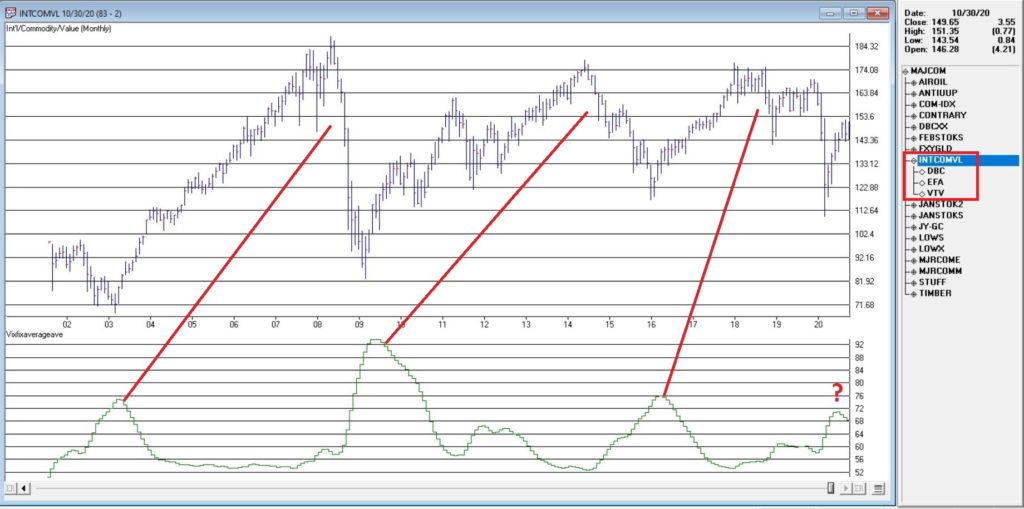
Figure 2 displays an index that I created and follow that tracks an international ETF, a commodity ETF and a value ETF. The VFAA indicator appears in the bottom clip.
Now if history is a guide, then the recent “rollover” by VFAA suggests that this particular grouping of asset classes should perform well in the coming years. Two things to note:
1. There is no guarantee
2. There is absolutely no sign yet that “the turn” – relative to the S&P 500 – is occurring
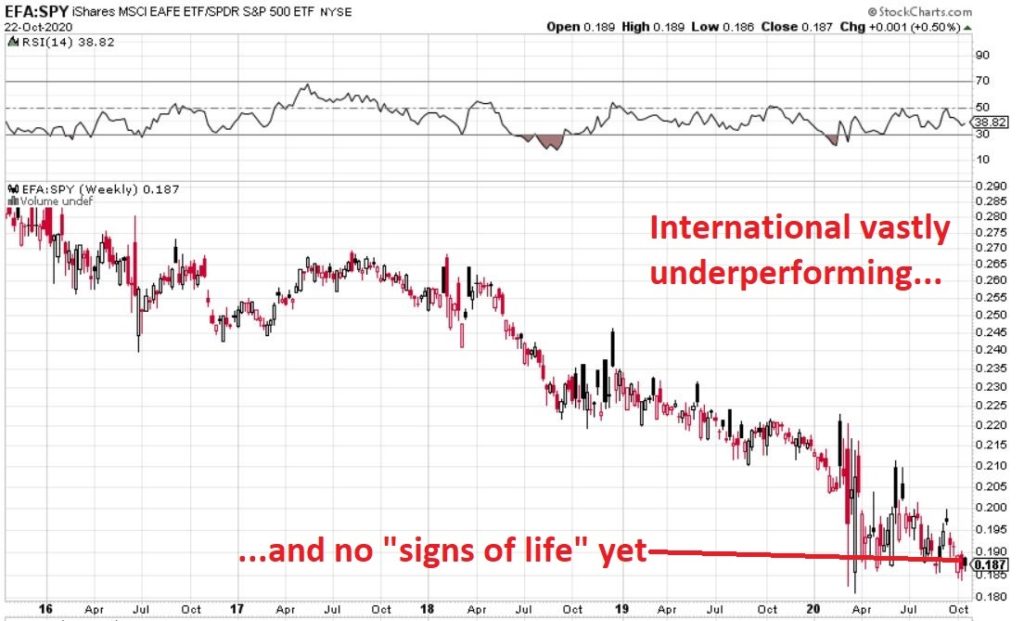
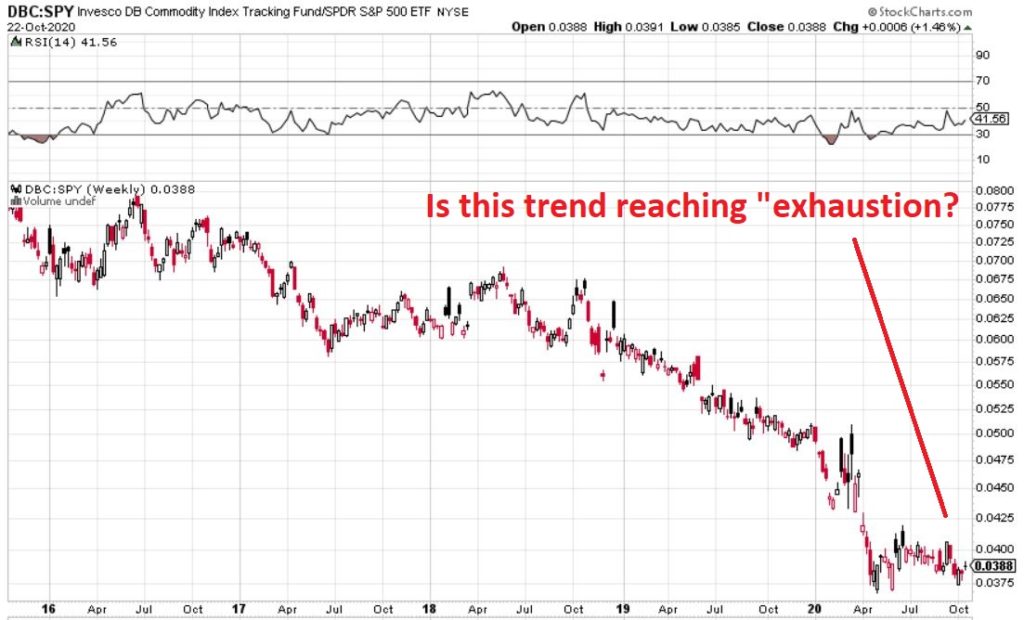
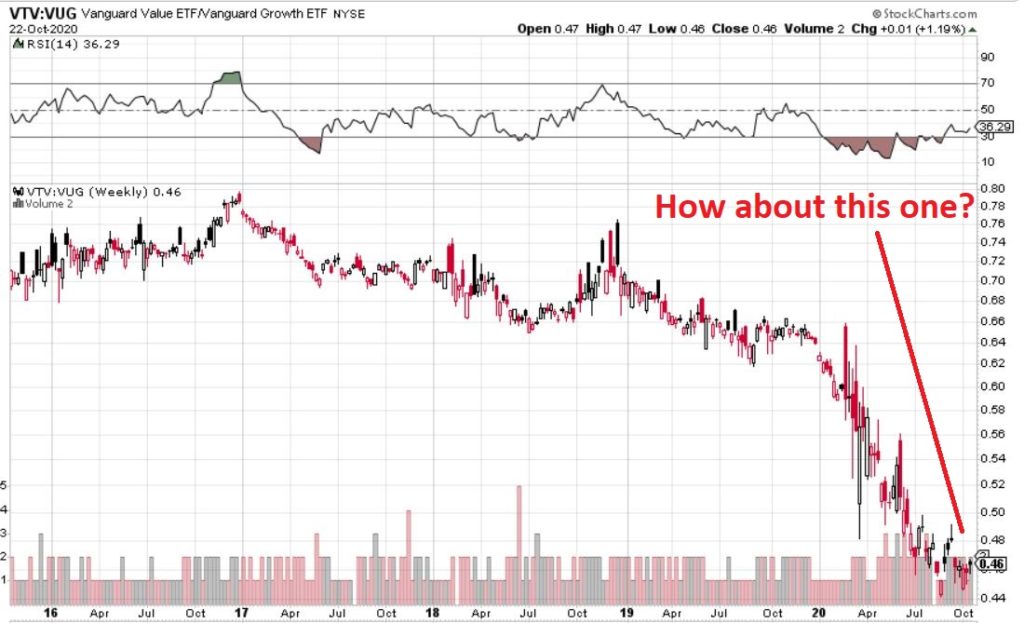
Figure 3, 4 and 5 are “relative strength” charts from www.StockCharts.com. They DO NOT display the price of any security; they display the performance of the first ETF list compared to the second ETF listed. So, Figure 3 displays the performance of ticker EFA (iShares MSCI EAFE ETF which tracks a broad index of stocks from around the globe, excluding the U.S.) relative to the S&P 500 Index.
When the bars are trending lower it means EFA is underperforming SPY and vice versa. The trend in Figure 3 is fairly obvious – international stocks continue to lose ground to U.S. large-cap stocks.
If your goal is to pick a bottom, have at it. As for me, I am waiting for some “signs of life” in international stocks relative to U.S. stocks before doing anything.
Figure 4 displays ticker DBC (a commodity-based ETF) versus SPY and Figure 5 displays ticker VTV (Vanguard Value ETF) versus ticker VUG (Vanguard Growth ETF). Both tell the same tale as Figure 3 – unless you are an avowed bottom-picker there is no actionable intelligence. Still, both these trends are now extremely overdone, so a significant opportunity may be forming.
*Nothing is happening at the moment with everything displayed above…
*…But something will (at least in my market-addled opinion) – so pay close attention.
Jay Kaeppel
Disclaimer: The information, opinions and ideas expressed herein are for informational and educational purposes only and are based on research conducted and presented solely by the author. The information presented represents the views of the author only and does not constitute a complete description of any investment service. In addition, nothing presented herein should be construed as investment advice, as an advertisement or offering of investment advisory services, or as an offer to sell or a solicitation to buy any security. The data presented herein were obtained from various third-party sources. While the data is believed to be reliable, no representation is made as to, and no responsibility, warranty or liability is accepted for the accuracy or completeness of such information. International investments are subject to additional risks such as currency fluctuations, political instability and the potential for illiquid markets. Past performance is no guarantee of future results. There is risk of loss in all trading. Back tested performance does not represent actual performance and should not be interpreted as an indication of such performance. Also, back tested performance results have certain inherent limitations and differs from actual performance because it is achieved with the benefit of hindsight.