For the record, I am an avowed “trend-follower.” But I also know that no trend lasts forever. So, while I have gotten pretty good at “riding along”, I do – like most people – like to “look ahead” since I do know that the landscape will forever be changing.
So, with the caveat that none of what follows should be considered a “call to action”, only as a “call to pay attention”, let’s venture out “into the weeds.”
AIROIL
Here is an ugly pairing – airline stocks and traditional energy stocks – yikes! In Figure 1 you see an index that I created and followed call AIROIL comprised of three airline stocks and five “Big Oil” stocks. During the pandemic meltdown this index fell to a level not seen since 2007 before “bouncing”.
Editors Note:
Jay's AIROIL Index is built using the AIQ Data Manager by creating a list andcreating a group ticker (in this case AIROIL). Stocks are inserted under the ticker and the index is then computed using Compute Group/Sector indices.
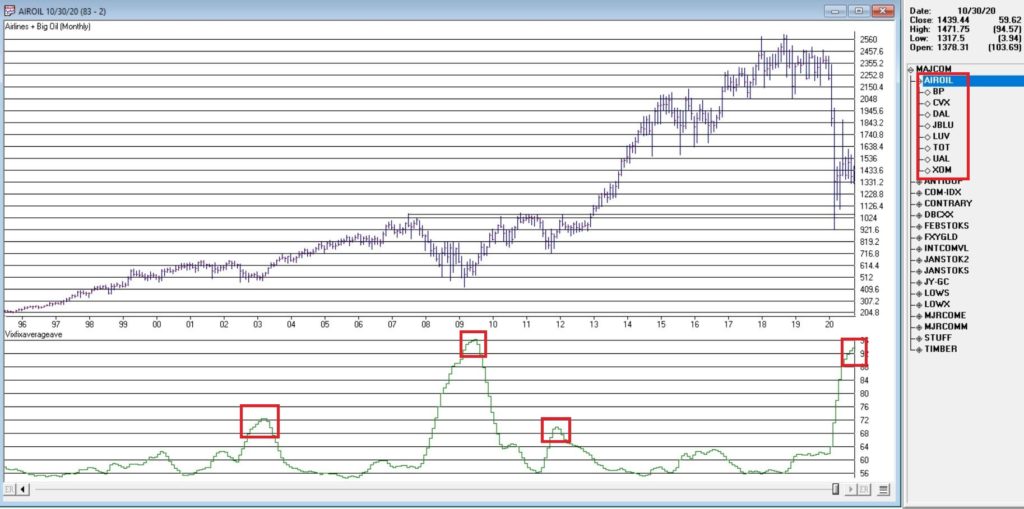
Figure 1 – Jay’s AIROIL Index (Courtesy AIQ TradingExpert)
In the bottom clip you see an indicator I call VFAA. Note that when VFAA tops out and rolls over, meaningful advances in the index tend to follow. In addition, VFAA is at a high level seen only once before in 2009. Following that reversal, the index rose almost 500% over the next 9 years.
So, is now a great time to pile into airlines and big oil? One would have to be a pretty hard-core contrarian to pound the table on this one. The airlines are in terrible shape due to the pandemic and vast uncertainty remains regarding when things might improve. And “Big Oil” is about as unloved as any sector has ever been.
So, am I suggesting anyone “load up” on airlines and oil? Nope. What I am saying is that I am watching this closely and that if and when VFAA “rolls over” I may look to commit some money to these sectors on a longer-term contrarian basis.
International/Commodities/Value
Also known of late as “the barking dogs”. If you have had money committed to any or all of these asset classes in recent years you are shaking your head right about now. These areas have VASTLY underperformed a simple “buy-and-hold the S&P 500 Index” approach for a number of years.
Is this state of affairs going to change anytime soon? Regarding “anytime soon” – it beats me. However, I am on the record as arguing that at some point this WILL change. History makes one thing very clear – no asset class has a permanent edge. So, given that the S&P 500 Index has beaten these above mentioned by such a wide margin for such a long time (roughly a decade or more) I am confident that one day in the next x years, the “worm will turn.”
Figure 2 displays an index that I created and follow that tracks an international ETF, a commodity ETF and a value ETF. The VFAA indicator appears in the bottom clip.
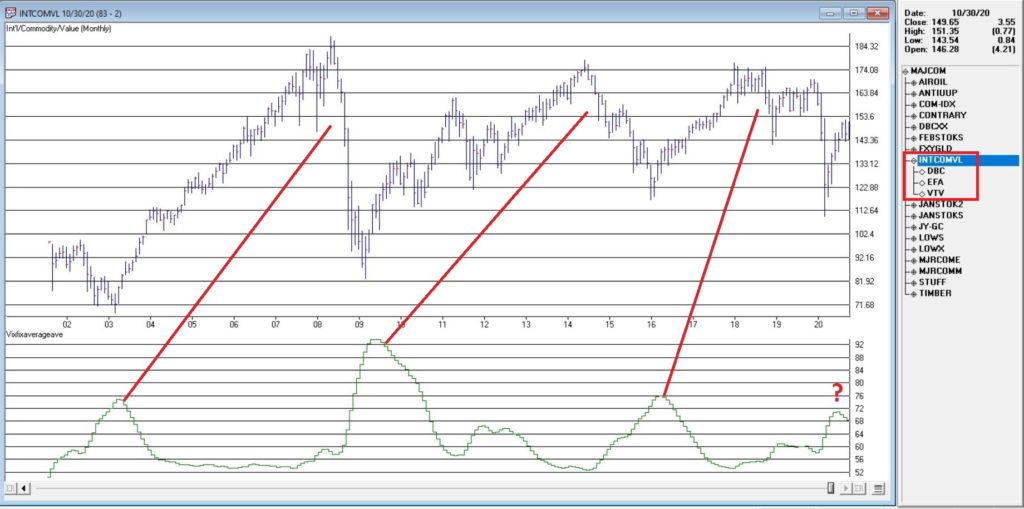
Figure 2 – Jay’s INTCOMVAL Index (Courtesy AIQ TradingExpert)
Now if history is a guide, then the recent “rollover” by VFAA suggests that this particular grouping of asset classes should perform well in the coming years. Two things to note:
1. There is no guarantee
2. There is absolutely no sign yet that “the turn” – relative to the S&P 500 – is occurring
Figure 3, 4 and 5 are “relative strength” charts from www.StockCharts.com. They DO NOT display the price of any security; they display the performance of the first ETF list compared to the second ETF listed. So, Figure 3 displays the performance of ticker EFA (iShares MSCI EAFE ETF which tracks a broad index of stocks from around the globe, excluding the U.S.) relative to the S&P 500 Index.
When the bars are trending lower it means EFA is underperforming SPY and vice versa. The trend in Figure 3 is fairly obvious – international stocks continue to lose ground to U.S. large-cap stocks.
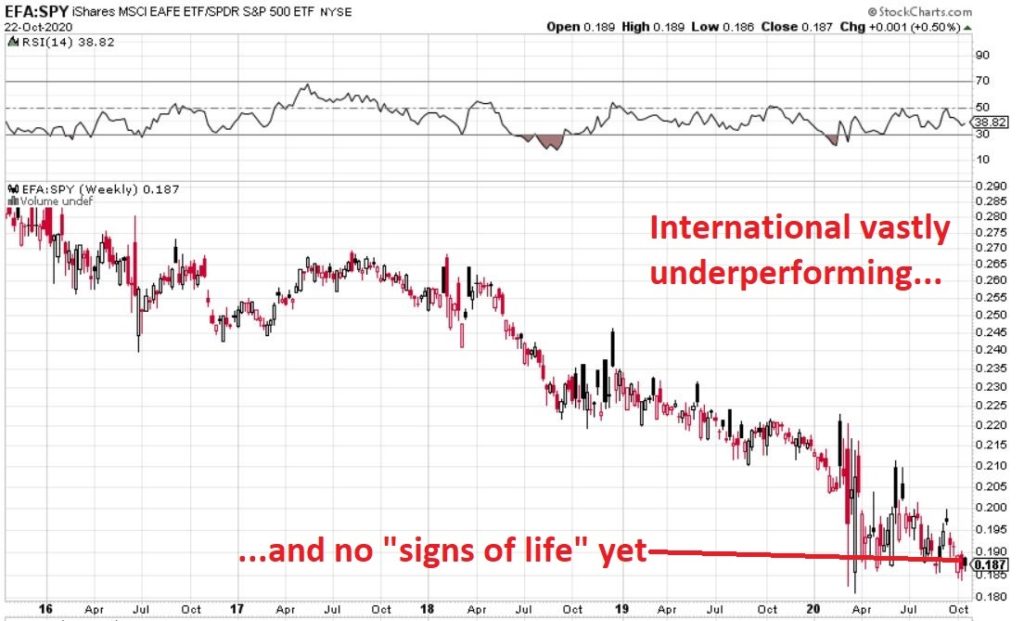
Figure 3 – Ticker EFA relative to ticker SPY (Courtesy: www.StockCharts.com)
If your goal is to pick a bottom, have at it. As for me, I am waiting for some “signs of life” in international stocks relative to U.S. stocks before doing anything.
Figure 4 displays ticker DBC (a commodity-based ETF) versus SPY and Figure 5 displays ticker VTV (Vanguard Value ETF) versus ticker VUG (Vanguard Growth ETF). Both tell the same tale as Figure 3 – unless you are an avowed bottom-picker there is no actionable intelligence. Still, both these trends are now extremely overdone, so a significant opportunity may be forming.
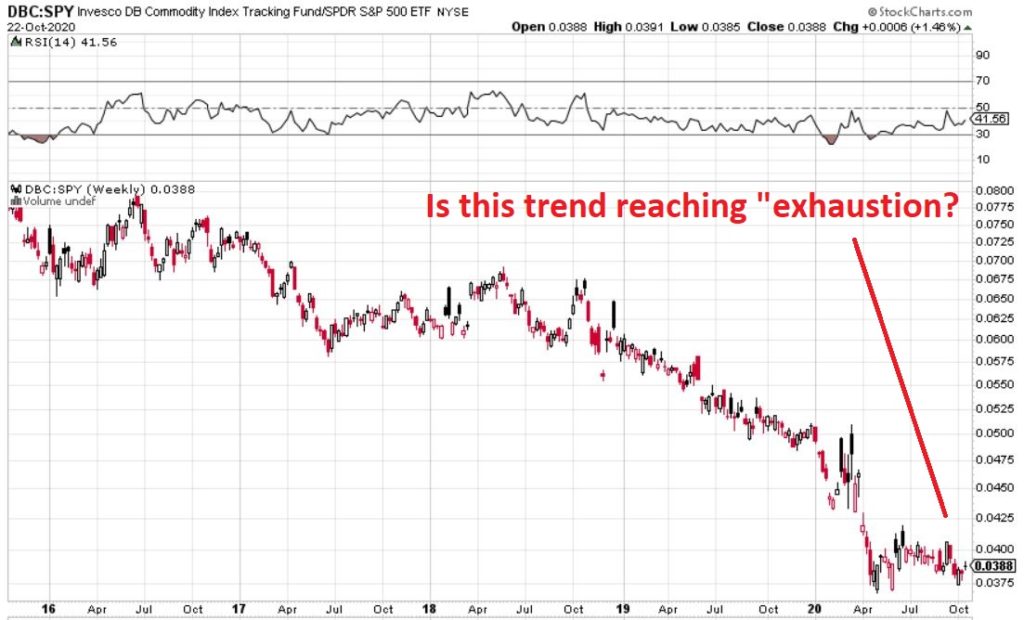
Figure 4 – Ticker DBC relative to ticker SPY (Courtesy: www.StockCharts.com)
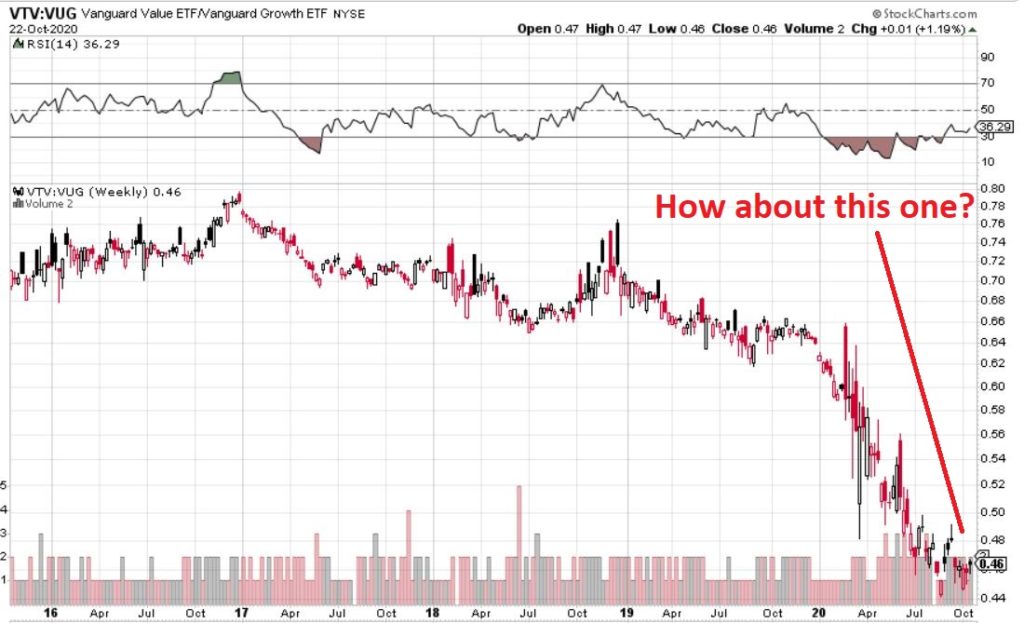
Figure 5 – Ticker VTV relative to ticker VUG (Courtesy: www.StockCharts.com)
Summary
Two key points as succinctly as possible:
*Nothing is happening at the moment with everything displayed above…
*…But something will (at least in my market-addled opinion) – so pay close attention.
Jay Kaeppel
Disclaimer: The information, opinions and ideas expressed herein are for informational and educational purposes only and are based on research conducted and presented solely by the author. The information presented represents the views of the author only and does not constitute a complete description of any investment service. In addition, nothing presented herein should be construed as investment advice, as an advertisement or offering of investment advisory services, or as an offer to sell or a solicitation to buy any security. The data presented herein were obtained from various third-party sources. While the data is believed to be reliable, no representation is made as to, and no responsibility, warranty or liability is accepted for the accuracy or completeness of such information. International investments are subject to additional risks such as currency fluctuations, political instability and the potential for illiquid markets. Past performance is no guarantee of future results. There is risk of loss in all trading. Back tested performance does not represent actual performance and should not be interpreted as an indication of such performance. Also, back tested performance results have certain inherent limitations and differs from actual performance because it is achieved with the benefit of hindsight.

