January 10, 2021
Hello Everyone,
Over the last month the stock and bond markets have increased again finishing off the year near or at an all-time high. This year the small and midcap stocks are up the most rising 5% as compared to the large indexes which are up about 1.7%. If the stock market continues to rise throughout the year I think the small and midcaps as well as the international stocks are now in the sweet spot of the sectors to continue higher. Now that President Elect Biden is Commander in Chief, the markets will be addressing his policies, some are good and some are not so good for the corporations. I still like the stock markets here for a HOLD not an outright aggressive BUY as the stock market is now14% Overvalued. My Computer models are on a HOLD scenario, depending on your goals and objectives I would have more in the Small, Midcap and International Sectors. Over the next month I feel the markets can put in a Short term top and have a little setback, but Long term I am still bullish on the stock markets. I am NOT Bullish on outright average bond funds as interest rates could continue to rise depressing ordinary bonds. Because of that, Floating rate bonds, inflation-protected bonds and short-term bonds tend to hold up better. Long-term bonds, in my opinion, should be reallocated to the short term to intermediate bond, inflation-protected bond, and the floating rate sector. In the stock market, I still like growth stocks and value stocks. For the aggressive investor over the long term, I like the BlockChain technology sector, the new internet of things, the autonomous car sector, and more… My computer models are still on a Hold signal but can change at any time as the market is very overbought, so it is important to contact me to review your accounts at 860-940-7020.
One year from now I expect the economy to be much better than it is currently with the vaccine now being administered by Pfizer and other companies. This should benefit hard-hit restaurants, airlines, parks, and more.
Some of the INDEXES of the markets both equities and interest rates are below. The source is Morningstar.com up until January 08, 2021. These are passive indexes.
YTD
Dow Jones +1.72%
S&P 500 +1.97%
EQUAL WEIGHTED S&P 500 +2.96%
NASDAQ Aggressive growth +1.69%
Large Cap Value +3.0%
I Shares Russell 2000 ETF (IWM) Small cap +5.95%
Midcap stock funds +4.83%
International Index (MSCI – EAFE ex USA +2.7%
International Emerging Markets +5.88%
Financial stocks -5%
Energy stocks -28%
Healthcare Stocks +11%
Moderate Mutual Fund Investment Grade Bonds (AAA) Long duration -0.3%
High Yield Merrill Lynch High Yield Index +0.1%
Floating Rate Bond Funds +.7%
Short Term Bond +.1%
Multi sector bond funds -.1%
Gold -2.81%
10 year Bond Yield 1%
Classicalprinicples.com and Robert Genetskis Excerpts
Market Outlook
With investors anticipating the free flow of new money and new spending to prime the economy, stocks are moving sharply higher.
One of Biden’s promises to Georgia was everyone would get $2,000 checks if they won the state. That’s for appetizers. Watch out for the main meal. Biden’s economic advisers assure him government can spend and borrow whatever is needed to get unemployment back down to 3½%. However, raising the federal minimum wage will make it more difficult to reduce unemployment. The Fed has already signed on to keep the money flowing.
What could go wrong?
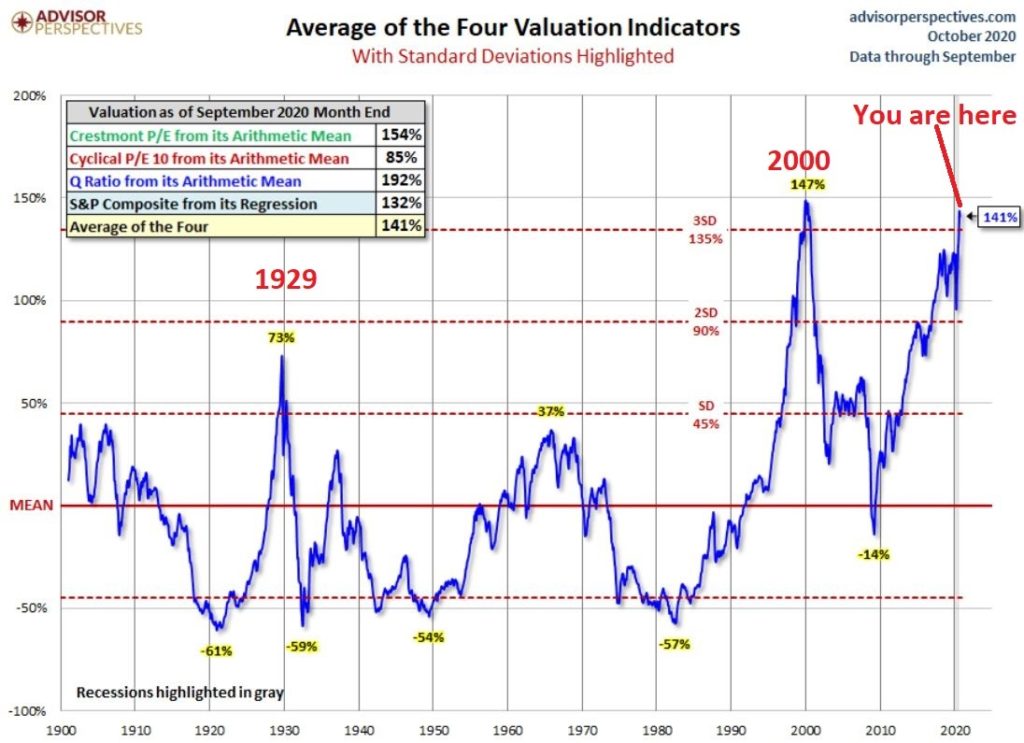
The spike in longer-term interest rates following the outcome in Georgia is the canary in the coal mine. The Fed will try and hold interest rates down for a while, but the market will gradually win the tug of war with the Fed later this year. The S&P500 is now 14% above its fundamental value. The more overvalued it gets, the greater the risk of a correction. Even so, stocks remain preferable to fixed-income assets. The economy is surging as we start the new year. In spite of Covid and lockdowns, upcoming earnings reports as well as forward guidance should improve. Stay bullish.
A Look Back
Today’s employment report shows the job market remains weak amid a decline of 140,000 payroll jobs in December. The number was driven by a decline of ½ million jobs in leisure, hospitality, and government. The amazing thing is how strong the economy is performing in spite of the loss of jobs in these areas.
Stock Valuation: S&P 500 14% Overvalued
Economic Fundamentals: Positive
Monetary Policy; Highly Expansive
.
Source: Classical Principles.com
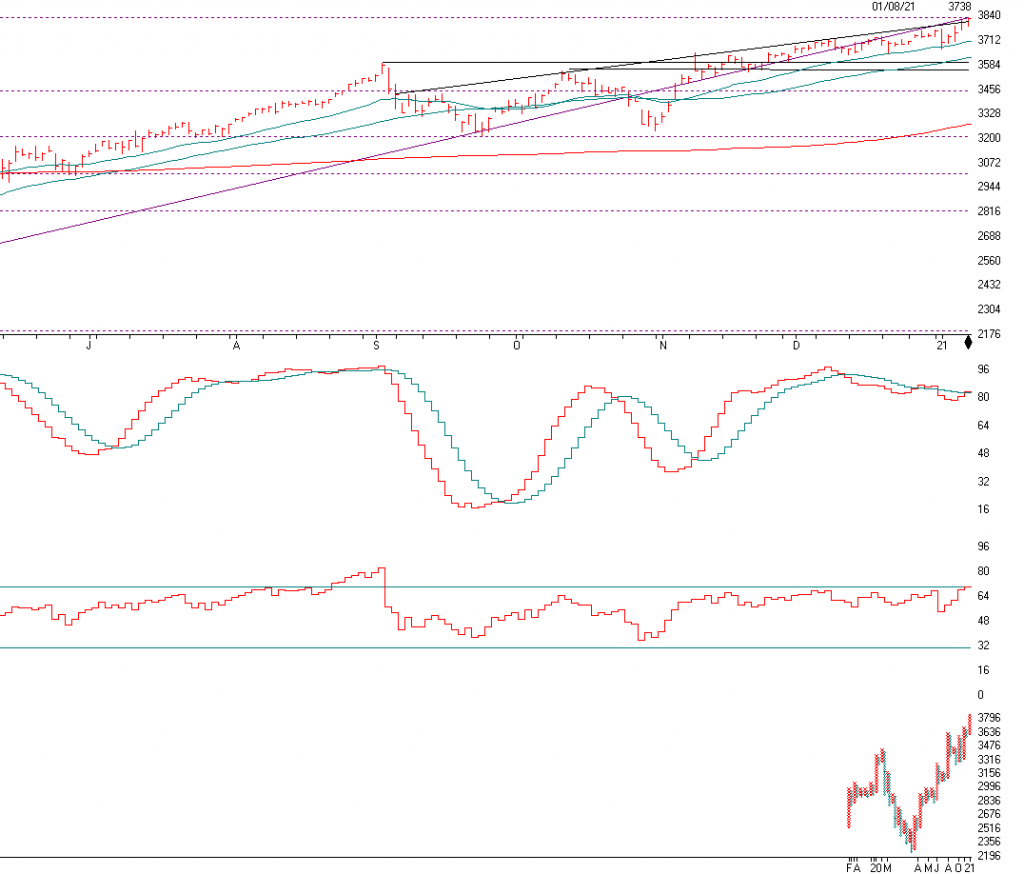
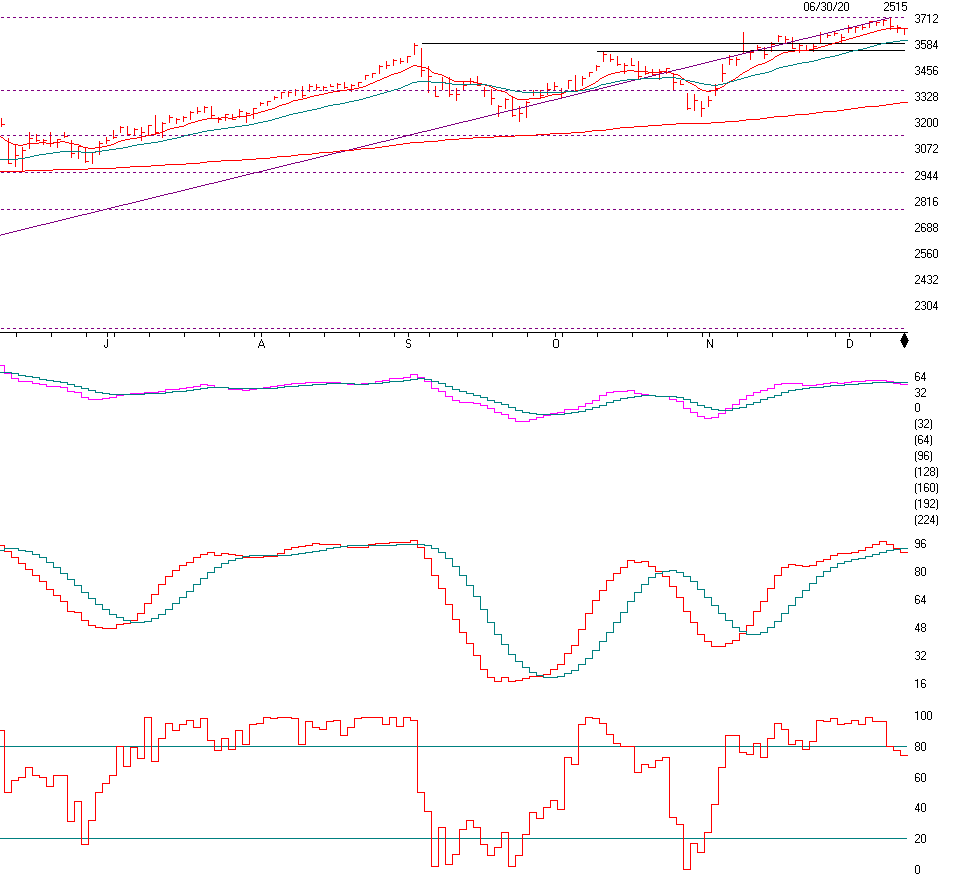
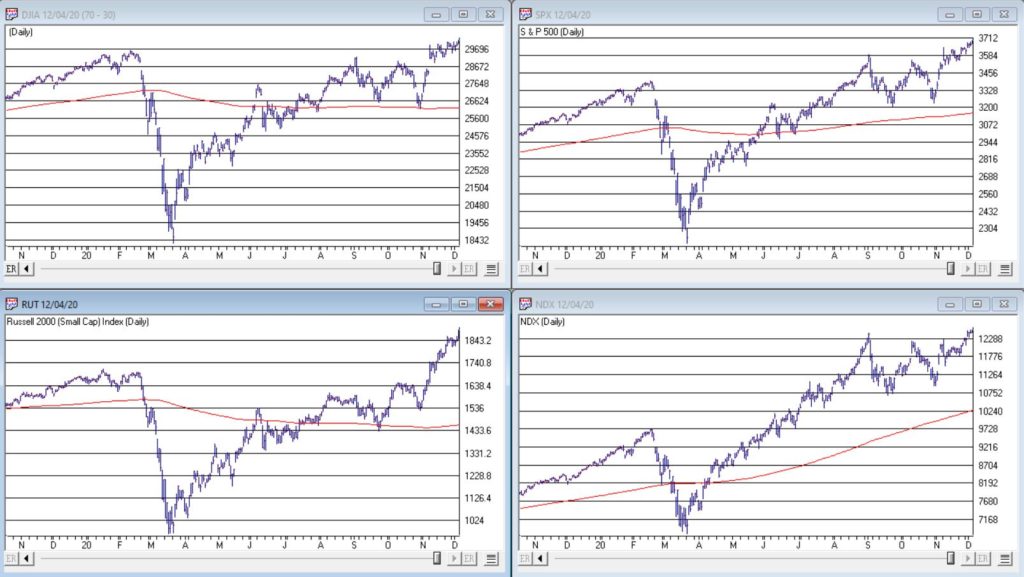
The S&P 500 is above. The S&P is now at a new high as it continues to go up in value. As the market continues to rise in anticipation of the economy rebounding it is perplexing many people on WHY it is rising so much. It is because earnings are coming in better than expectations. Also, the market anticipates 6-9 months AHEAD of time. They think that by September the economy should be on its way to recovery. So it’s like waiting in line for a great musical act. Many people wait in line hours before the concert to get the best seating. The markets are somewhat similar. They know the economy will recover so they are buying now in advance of the recovery and the earnings recovery as well.
The SK-SD Stochastics indicator. I use this indicator to determine when the market is overbought or oversold. When the markets are dramatically overbought, OVER 88, you might want to reduce equities somewhat and when it’s under 40 you may want to accumulate equities. It is at 80 now so it is not so bad, but be a little careful short term.
The RSI Wilder Index is next. When the index is over 70, the market is getting very overbought. In September it did just that and sold off quickly. The RSI Wilder index is at 69.7 now, so we have another indicator that equities are overbought.
The indicator POINT and Figure Chart is next. Point and figure charts are a way to visualize price movements and trends in an asset without regard to the amount of time that passes. P&F charts utilize columns consisting of stacked Xs or Os, each of which represents a set amount of price movement. The X’s illustrate rising prices, while Os represent a falling price.
Support levels on the
S&P 500 area are 3640, 3594, 3358, 3440 and 3201.
NASDAQ Support, 12971, 12751, 12600, 12217, 12089, and 11350.
Dow Jones 30681, 29559, 29215, 28018, 28482, and 27100
These may be safer areas to get into the equity markets on support levels slowly on the accumulation areas.
THE BOTTOM LINE:
The market has continued nicely over the last month mainly because of earnings of companies beating expectations and a recognition that the economy will eventually return to a growth pattern. The market looks to continue to grow and as the economy comes out of its recession, the small and midcap stocks as well as the large stocks should continue to do well over the next few years. The NASDAQ has done the best this year and should continue to do well IF the market continues higher. Now that the vaccine is a reality the value stocks should start to rise. I like international stocks as well. Diversification is now important as the first 5 months of the recovery have been all large growth.
Best to all of you,
Joe Bartosiewicz, CFP®
Investment Advisor Representative
92 High Street
Thomaston, CT 06787 and
7501 East MCDowell RD #2172
Scottsdale, AZ 85257
Securities and advisory services offered through SagePoint Financial, Inc. (SPF), member FINRA/SIPC. SPF is separately owned and other entities and/or marketing names, products or services referenced here are independent of SPF. 800-552-3319 20 East Thomas Road Ste 2000 Phoenix AZ 85012
Technical Analysis is based on a study of historical price movements and past trend patterns. There is no assurance that these market changes or trends can or will be duplicated shortly. It logically follows that historical precedent does not guarantee future results. Conclusions expressed in the Technical Analysis section are personal opinions: and may not be construed as recommendations to buy or sell anything.
Disclaimer: The views expressed are not necessarily the view of Sage Point Financial, Inc. and should not be interpreted directly or indirectly as an offer to buy or sell any securities mentioned herein. Securities and Advisory services offered through Sage Point Financial Inc., Member FINRA/SIPC, an SEC-registered investment advisor.
Past performance cannot guarantee future results. Investing involves risk, including the potential loss of principal. No investment strategy can guarantee a profit or protect against loss in periods of declining values. Please note that individual situations can vary. Therefore, the information presented in this letter should only be relied upon when coordinated with individual professional advice. *There is no guarantee that a diversified portfolio will outperform a non-diversified portfolio in any given market environment. No investment strategy, such as asset allocation, can guarantee a profit or protect against loss in periods of declining values.
It is our goal to help investors by identifying changing market conditions. However, investors should be aware that no investment advisor can accurately predict all of the changes that may occur in the market.
What is the Advance-Decline Line? Point and figure charts are a way to visualize price movements and trends in an asset without regard to the amount of time that passes. P&F charts utilize columns consisting of stacked Xs or Os, each of which represents a set amount of price movement. The Xs illustrate rising prices, while Os represent a falling price
The price of commodities is subject to substantial price fluctuations of short periods and may be affected by unpredictable international monetary and political policies. The market for commodities is widely unregulated, and concentrated investing may lead to Sector investing may involve a greater degree of risk than investments with broader diversification.
Indexes cannot be invested indirectly, are unmanaged, and do not incur management fees, costs, and expenses.
Dow Jones Industrial Average: A weighted price average of 30 significant stocks traded on the New York Stock Exchange and the NASDAQ.
S&P 500: The S&P 500 is an unmanaged indexed comprised of 500 widely held securities considered to be representative of the stock market in general.
NASDAQ: the NASDAQ Composite Index is an unmanaged, market-weighted index of all over the counter common stocks traded on the National Association of Securities Dealers Automated Quotation System
(IWM) I Shares Russell 2000 ETF: Which tracks the Russell 2000 index: which measures the performance of the small-capitalization sector of the U.S. equity market.
A Moderate Mutual Fund risk mutual has approximately 50-70% of its portfolio in different equities, from growth, income stocks, international and emerging markets stocks to 30-50% of its portfolio in different categories of bonds and cash. It seeks capital appreciation with a low to moderate level of current income.
The Merrill Lynch High Yield Master Index: A broad-based measure of the performance of non-investment grade US Bonds
MSCI EAFE: the MSCI EAFE Index (Morgan Stanley Capital International Europe, Australia, and Far East Index) is a widely recognized benchmark of non-US markets. It is an unmanaged index composed of a sample of companies’ representative of the market structure of 20 European and Pacific Basin countries and includes reinvestment of all dividends.
Investment-grade bond index: The S&P 500 Investment-grade corporate bond index, a sub-index of the S&P 500 Bond Index, seeks to measure the performance of the US corporate debt issued by constituents in the S&P 500 with an investment-grade rating. The S&P 500 Bond index is designed to be a corporate-bond counterpart to the S&P 500, which is widely regarded as the best single gauge of large-cap US equities.
Floating Rate Bond Index is a rule-based, market-value weighted index engineered to measure the performance and characteristics of floating-rate coupon U.S. Treasuries, which have a maturity greater than 12 months.