OK, for the record, I have stood in enough long lines next to impossibly sweaty people (Full Disclosure: They likely feel the same way about me) to know that all of the talk of “Disney” and “Magic” is strictly for marketing consumption. That being said – and despite the fact that you cannot attend the flagship property in sunny CA, and likely will not be able to for some time – there is something about “going to Disney” that still strikes a chord with a whole lot of people.
Of course, my interest here is more financial in nature.
Now the “rational” thing to do in the minds of most investors is to ask and answer some serious questions regarding “theme park attendance.” in the age of COVID-19. Questions like “will attendance pick up anytime soon” and “will DIS continue to be an economic powerhouse if attendance does not return to pre-Covid levels?”
Here is a link to a factual, well-researched and well-written article noting that Disney World attendance as of 8/21/20, attendance was down 80% from a year earlier. Scary stuff, right? And the snap implication is fairly obvious – theme parks are suffering and may continue to do so for the foreseeable future.
But as I mentioned, my interest is more financial in nature. And I tend to look at things from a slightly different angle than a lot of other people. Part of that is because I have come to recognize that (like a lot of other people, but sadly unbeknownst to a lot of those same people) I (and they) am not very good at accurately answering “questions about the future”, such as those posed above about theme parks.
I read that theme park attendance is “down 80%” and instantly that voice in my head loudly issues that age-old “DANGER! WARNING WILL ROBINSON” alert and I feel the urge to scurry off in the other direction. But fortunately, I have gotten pretty good at not overreacting to that initial warning and coming back for a second glance.
Consider Figure 1. The date marked by the vertical line is August 21, 2020, i.e., the day that the news came out that “Disney World attendance is down 80%, that heavy discounting going on, that Disney stock is down for the year and that it is lagging the major stock indexes.”
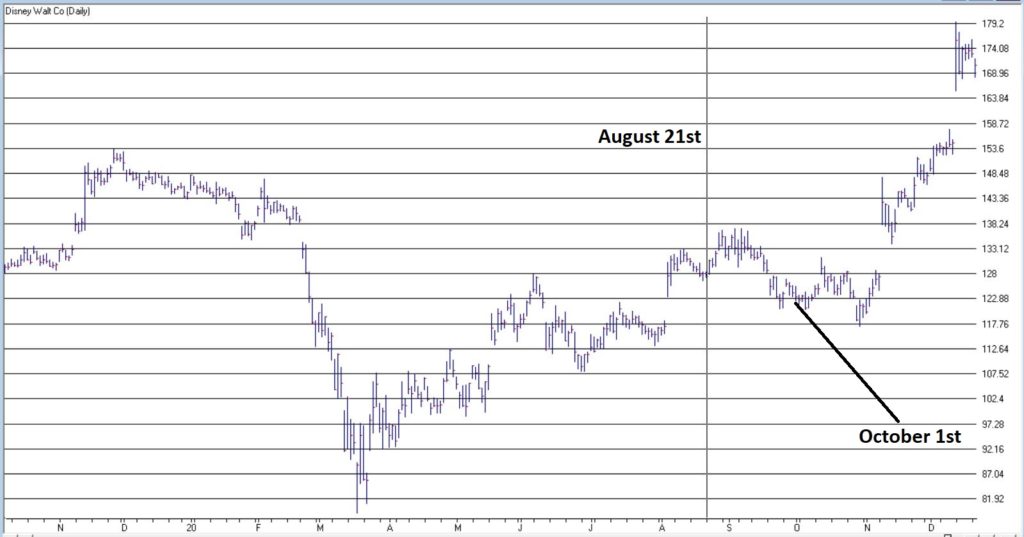
Figure 1 – Disney stock (Courtesy AIQ TradingExpert)
Since that “DANGER! WARNING WILL ROBNINSON” moment, DIS is up +34% in 4 months, versus +9% for the S&P 500 Index (FYI, DIS is now up 18% for 2020 vs. 14%+ for the S&P 500).
Are the financial markets a perverse beast, or WHAT!?
The “Real Magic” of Disney Stock
So, what the heck happened to make DIS stock burst higher even in the face of seemingly very bad fundamental news? Well, long story short, October 1st happened. Wait, what? October 1st? Surely it can’t be that simple!?
Here’s the thing: it probably should not be that simple. And there is absolutely no guarantee that it will continue to be that simple. But for the past roughly 6 decades…. it has been just about that simple. Consider Figure 2.
Figure 2 displays the cumulative % gain for DIS stock held ONLY from October 1st each year through the end of May the following year, every year since 1962.
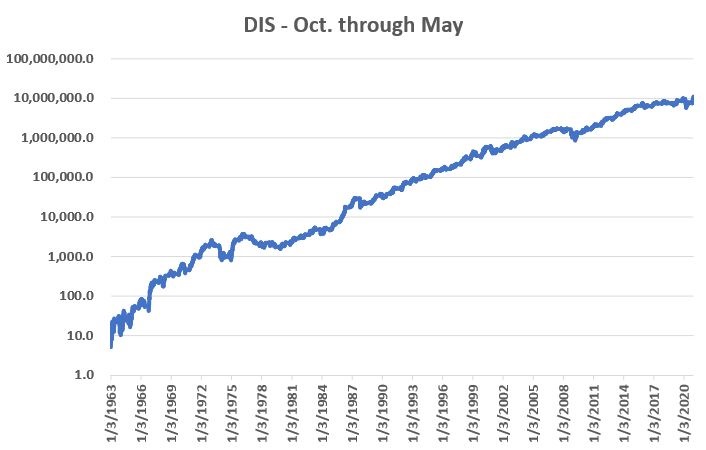
Figure 2 – DIS % +(-) during October through May (logarithmic scale)
An initial $1,000 investment in DIS stock held only October through May starting in 1962 is worth $108,512,237 as of 12/18/2020, or a gain of +10,851,124%.
Figure 3 displays the cumulative % gain for DIS stock held ONLY from June 1st each year through the end of September that same year, every year since 1962.
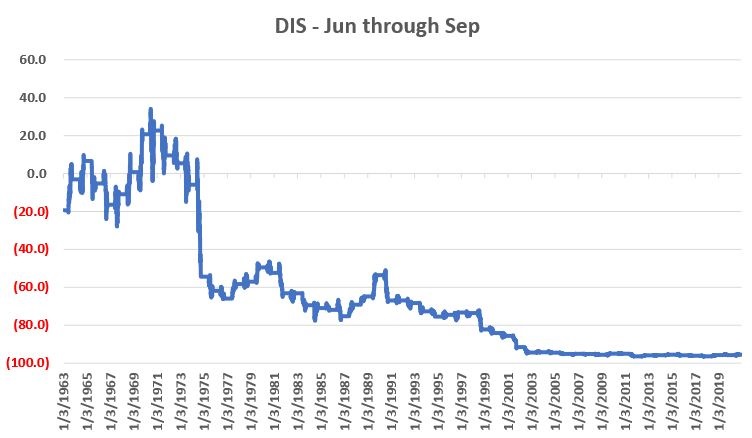
Figure 3 – DIS % +(-) during June through September (non-logarithmic scale)
An initial $1,000 investment in DIS stock held only June through September starting in 1962 is worth $44.86 as of 12/18/2020, or a loss of -95.5%.
The Upshot
Many investors will ask the obvious question of “Why does this work?” And the most succinct answer I can proffer is “It beats me.” Obviously, many investors will not be satisfied with that answer. And that is perfectly OK by me. As a proud graduate of “The School of Whatever Works” I tend to value “consistency” more than I do cause and effect. Not everyone is wired that way and that’s OK.
Speaking of consistency, for what it is worth Figure 4 displays decade-by-decade results for the Oct-May period versus the Jun-Sep period.
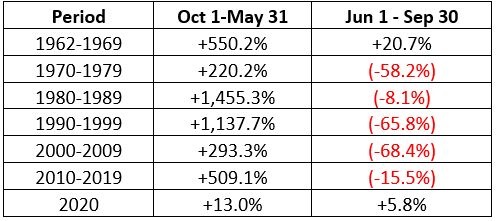
Figure 4 – DIS decade-by-decade
The key things to note are that:
*The Oct-May period showed a pretty substantial gain during each of the 6 previous decades.
*The Jun-Sep period showed a gain during the 60’s but lost money in every subsequent decade
(Note 2020 results through 12/18 are included in the table but are not a part of the commentary above).
Summary
Clearly the Oct-May period has been pretty “magical” for DIS stock investors for a long time. Will this continue to be the case in the future? Ah, there’s the rub. And as always, I must repeat once again my stock answer of “It beat’s me.”
But the real point is that in the long run investment success has a lot to do with finding and “edge” and exploiting it repeatedly. Or as I like to say:
“Opportunity is where you find it.”
See also Jay Kaeppel Interview in July 2020 issue of Technical Analysis of Stocks and Commodities magazine
See also Jay’s “A Strategy You Probably Haven’t Considered” Video
See also Video – The Long-Term…Now More Important Than Ever
Jay Kaeppel
Disclaimer: The information, opinions and ideas expressed herein are for informational and educational purposes only and are based on research conducted and presented solely by the author. The information presented represents the views of the author only and does not constitute a complete description of any investment service. In addition, nothing presented herein should be construed as investment advice, as an advertisement or offering of investment advisory services, or as an offer to sell or a solicitation to buy any security. The data presented herein were obtained from various third-party sources. While the data is believed to be reliable, no representation is made as to, and no responsibility, warranty or liability is accepted for the accuracy or completeness of such information. International investments are subject to additional risks such as currency fluctuations, political instability and the potential for illiquid markets. Past performance is no guarantee of future results. There is risk of loss in all trading. Back tested performance does not represent actual performance and should not be interpreted as an indication of such performance. Also, back tested performance results have certain inherent limitations and differs from actual performance because it is achieved with the benefit of hindsight.