December 12, 2020
Hello Everyone,
Over the last month the stock and bond markets have increased again. November has been one of the best months for all of the indexes not just the technology sector. The small and midcap stocks started to pick up steam last month, rising over 10% as compared to the 2 to 4% on the Dow, S&P and NASDAQ. I continue to like the small and midcap funds as well as the value sector especially as the vaccine application gets even closer. We are still in a seasonally strong time for the market, but the senate elections in January may cause volatility depending on the results. My computer models are still on a Buy-Hold signal but can change at anytime.
One year from now I expect the economy to be better than it is currently with the vaccine now being administered by Pfizer and other companies. This should benefit the hard hit restaurants, airlines, parks, and more. If you are within 1 to 3 years of your retirement I would rebalance your portfolio, as the markets have done well and are about 10% overvalued. If you haven’t had a strategy meeting with me in the last 6 months please call me to set a time to go over all of your holdings holistically, including your 401(k) and more.
Some of the INDEXES of the markets both equities and interest rates are below. The source is Morningstar.com up until December 12, 2020. These are passive indexes.
YTD
Dow Jones +7.8%
S&P 500 +15.%
EQUAL WEIGHTED S&P 500 +10.7%
NASDAQ Aggressive growth +31%
Large Cap Value +3.0%
I Shares Russell 2000 ETF (IWM) Small cap +16%
Midcap stock funds +10%
International Index (MSCI – EAFE ex USA +6%
Financial stocks -5%
Energy stocks -28%
Healthcare Stocks +11%
Moderate Mutual Fund Investment Grade Bonds (AAA) Long duration +9.8%
High Yield Merrill Lynch High Yield Index +3.%
Floating Rate Bond Funds +1.2%
Short Term Bond +3.2%
Mutli sector bond funds +4.17%
Classicalprinicples.com and Robert Genetskis Excerpts
Market Outlook
The bull market in stocks continues. All five of the indexes are now at or within 1% of all-time highs. Small cap ETFs (!WM, IJR) were up close to 4%, the QQQ’s were up 3%, while the Nasdaq, S&P500 and Dow were flat to only slightly higher. The news for the week was mostly positive. While most are focusing on FDA’s approval of Pfizer’s vaccine, something even better may be coming along (See the Covid update on bottom of page.) The S&P500 remains 10% overvalued and most psychological indicators point to excessive bullishness. It would not be unusual for stocks to pull back from these levels. Even so, technical indicators remain positive. In addition, the tailwind from the Fed buying close to $100 billion a month suggests the bull market can continue. I remain comfortable with a recommended exposure of 90% equities and 10% cash in a standard portfolio. Individual exposure to stocks depends on individual characteristics.
A Look Back
Weekly initial unemployment claims increased to 853,000 in the first week of December. The 4- week average also increased to 776,000, up from 746,000 in November. The number of workers receiving insured unemployment payments increased 300,000 to 5.8 million, but down from 7 million a month ago. The insured unemployment rate was 3.9 million down from 5.0 million a month ago. Inflation data continue to be distorted by the volatile shift from lockdown to recovery. In the 6 months ending in November consumer prices were up at roughly a high 3½% annual rate. However, year-over-year consumer inflation remains a modest 1½%.
Stock Valuation: S&P 500 10% Overvalued
Economic Fundamentals: Positive
Monetary Policy; Highly Expansive
Good News amid Rising Covid Cases
As Covid deaths are recording new daily records, there is a heightened level of fear over the trend. There is also concern the rise in new cases and deaths will slow the economic recovery. In spite of complaints about a person without a medical degree passing along information on Covid treatments, I will continue to inform you about what I believe is credible information. You should be able to evaluate and decide for yourself if such information could be useful to you and your family and friends. Three days ago, Dr. Pierre Kory, head of an international association of doctors specializing in treating Covid patients, testified before Congress. His group of doctors claims they now have a protocol that provides the most effective means of both preventing and treating Covid. Dr. Kory says no one needs to be infected or die from Covid any longer. The protocol uses Ivermectin Oral, a widely used medicine for treating parasites. Dr. Kory’s group says it is safe and inexpensive.
Source: Classical Principles.com
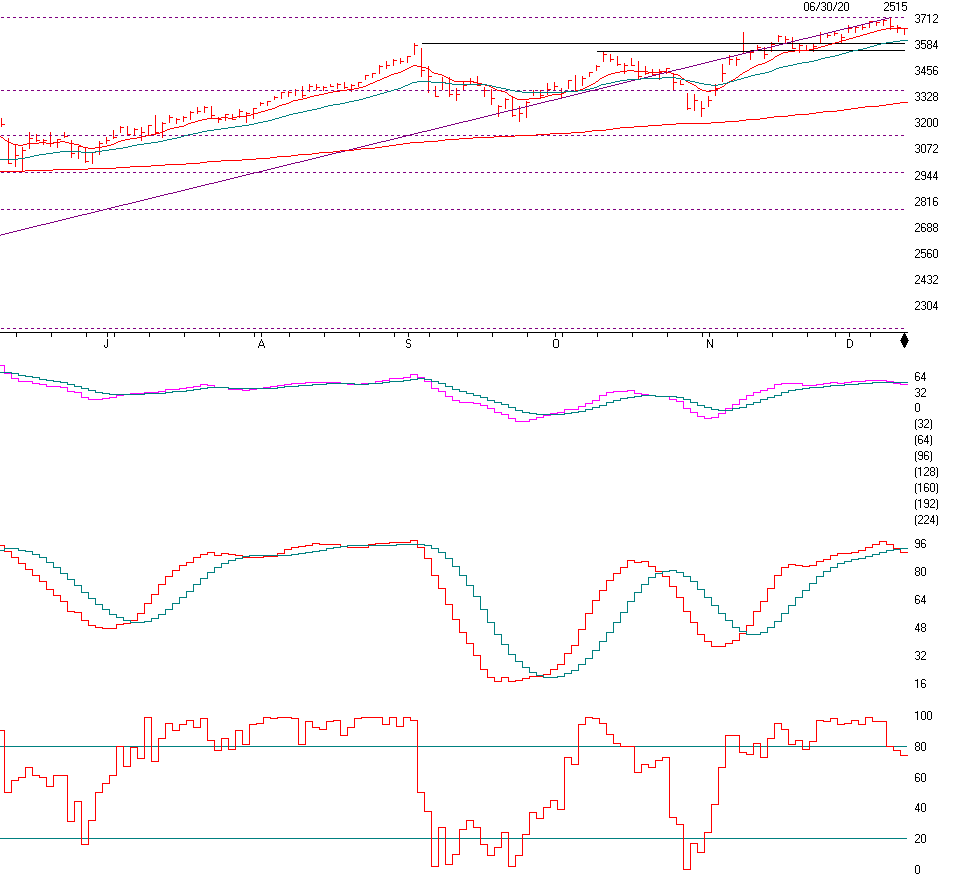
The S&P 500 is above. As you can see, the November to December time period went up nicely, but over the last few days the market has become tired and unless we get a stimulus package that will excite the market, we may see a pullback to the 3551 to the 3604 level. If that level breaks decisively then there is no real support until it gets to 3357 or the 200 day moving average. I don’t see more volatility than that as we are currently on a Buy-Hold in this market.
The first indicator is the MACD or the Moving Average Covergence Divergence indicator. The Buys and Sells are given when the indicators cross. This daily indicator is more for shorter term trades. On the weekly chart the MACD is still positive.
The SK-SD Stochastics indicator. I use this indictor to determine when the market is overbought or oversold. When the markets are dramatically over bought, OVER 88, you might want to reduce equities some what and when it’s under 40 you may want to accumulate equities. It is above 88 and crossed on the downside, so be a little careful short term.
The Stochastics indicator. The Buys are given when the indicator goes below 20 and then rises above 20 and the Sells are given when the indicator drops below 80 and it just did. Even though the LONG TERM signals are still positive, the Short term may be a little volatile. If the US Governement has another stimulus program the market can again rise.
Support levels
S&P 500 area are 3636, 3550, 3357 and 3209.
NASDAQ Support, 12075, 11970, 11749 and 11369.
Dow Jones 29970, 29564, 28837, 28474, and 26146
These may be safer areas to get into the equity markets on support levels slowly on the accumulation areas.
THE BOTTOM LINE:
The market has continued nicely over the last month mainly because of earnings of companies beating expectations and a recognition that the economy will eventually return to a growth pattern. The market looks to continue to grow and as the economy comes out of its recession, the small and midcap stocks as well as the large stocks should continue to do well over the next few years. The NASDAQ has done the best this year and should continue to do well IF the market continues higher. Now that the vaccine is a reality the value stocks should start to rise. I like the international stocks as well. Diversification is now important as the first 5 months of the recovery has been all large growth.
Joe Bartosiewicz, CFP®
92 High Street
Thomaston, CT 06787
860-940-7020
Securities and advisory services offered through SagePoint Financial, Inc. (SPF), member FINRA/SIPC. SPF is separately owned and other entities and/or marketing names, products or services referenced here are independent of SPF. 800-552-3319 20 East Thomas Road Ste 2000 Phoenix AZ 85012
Technical Analysis is based on a study of historical price movements and past trend patterns. There is no assurance that these market changes or trends can or will be duplicated shortly. It logically follows that historical precedent does not guarantee future results. Conclusions expressed in the Technical Analysis section are personal opinions: and may not be construed as recommendations to buy or sell anything.
Disclaimer: The views expressed are not necessarily the view of Sage Point Financial, Inc. and should not be interpreted directly or indirectly as an offer to buy or sell any securities mentioned herein. Securities and Advisory services offered through Sage Point Financial Inc., Member FINRA/SIPC, an SEC-registered investment advisor.
Past performance cannot guarantee future results. Investing involves risk, including the potential loss of principal. No investment strategy can guarantee a profit or protect against loss in periods of declining values. Please note that individual situations can vary. Therefore, the information presented in this letter should only be relied upon when coordinated with individual professional advice. *There is no guarantee that a diversified portfolio will outperform a non-diversified portfolio in any given market environment. No investment strategy, such as asset allocation, can guarantee a profit or protect against loss in periods of declining values.
It is our goal to help investors by identifying changing market conditions. However, investors should be aware that no investment advisor can accurately predict all of the changes that may occur in the market.
The price of commodities is subject to substantial price fluctuations of short periods and may be affected by unpredictable international monetary and political policies. The market for commodities is widely unregulated, and concentrated investing may lead to Sector investing may involve a greater degree of risk than investments with broader diversification.
Indexes cannot be invested indirectly, are unmanaged, and do not incur management fees, costs, and expenses.
Dow Jones Industrial Average: A weighted price average of 30 significant stocks traded on the New York Stock Exchange and the NASDAQ.
S&P 500: The S&P 500 is an unmanaged indexed comprised of 500 widely held securities considered to be representative of the stock market in general.
NASDAQ: the NASDAQ Composite Index is an unmanaged, market-weighted index of all over the counter common stocks traded on the National Association of Securities Dealers Automated Quotation System
(IWM) I Shares Russell 2000 ETF: Which tracks the Russell 2000 index: which measures the performance of the small capitalization sector of the U.S. equity market.
A Moderate Mutual Fund risk mutual has approximately 50-70% of its portfolio in different equities, from growth, income stocks, international and emerging markets stocks to 30-50% of its portfolio in different categories of bonds and cash. It seeks capital appreciation with a low to moderate level of current income.
The Merrill Lynch High Yield Master Index: A broad-based measure of the performance of non-investment grade US Bonds
MSCI EAFE: the MSCI EAFE Index (Morgan Stanley Capital International Europe, Australia, and Far East Index) is a widely recognized benchmark of non-US markets. It is an unmanaged index composed of a sample of companies’ representative of the market structure of 20 European and Pacific Basin countries and includes reinvestment of all dividends.
Investment grade bond index: The S&P 500 Investment-grade corporate bond index, a sub-index of the S&P 500 Bond Index, seeks to measure the performance of the US corporate debt issued by constituents in the S&P 500 with an investment-grade rating. The S&P 500 Bond index is designed to be a corporate-bond counterpart to the S&P 500, which is widely regarded as the best single gauge of large-cap US equities.
Floating Rate Bond Index is a rule-based, market-value weighted index engineered to measure the performance and characteristics of floating-rate coupon U.S. Treasuries, which have a maturity greater than 12 months.