Editor’s note:
Jay published this post on 12/28/20, we are including this now to illustrate the seasonality pattern in action. At the end of this article we’ve included a Seasonality Chart from the current beta test of TradingExpert Pro 9.6 due out during this first quarter.
As you can see in Figure 1 from www.Sentimentrader.com below, January and February have historically been the best months for platinum.
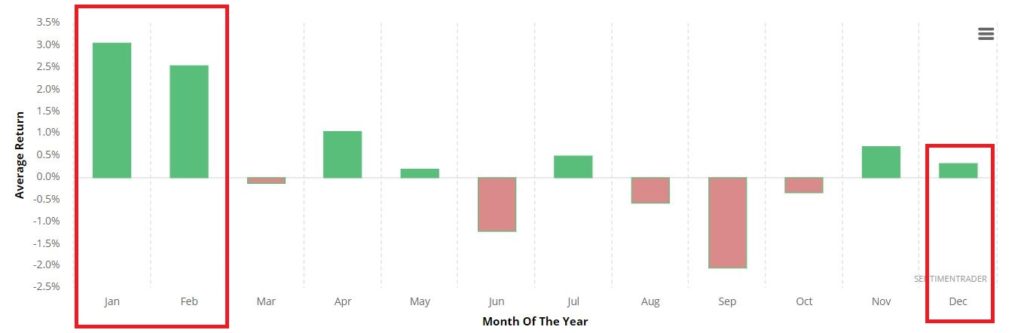
Figure 1 – Platinum Seasonality (Courtesy Sentimentrader.com)
And that is true if one looks at things on a calendar month basis. In this piece however, we are going to “cut things a little finer.”
Favorable Period for Platinum
For purposes of this piece, we will define the “Favorable Period” for platinum as:
*The 41 trading days (NOT calendar days) directly after the 13th trading day of December
Technically this period in 2020 started at the close on 12/17/20 and will extend through the close of trading on 2/18/2021.
So far in 2020 it is “so far, not so good”. From the 12/17 close through the 12/24 close platinum has declined from roughly $1,054 and ounce to roughly $1,027.
So, does this mean that “it is not working this time around”? Or do we have a better buying opportunity now than we did on 12/17? The reality is that I can’t answer those questions. All I can do is highlight the history and let everyone else make up their own mind.
The History
I have platinum futures historical data going back to October of 1977. So, we start our test in December 1977 and assume that a trader held a 1-lot of platinum futures (more on an ETF alternative later) every year during the “favorable period” defined above. Each full point movement for a platinum futures contract equals $50. So, if platinum futures advanced 10 points then the trader gains $500 and vice versa.
Figure 2 displays the cumulative hypothetical $ +(-) achieved by holding platinum ONLY during the favorable 41-day period every year.
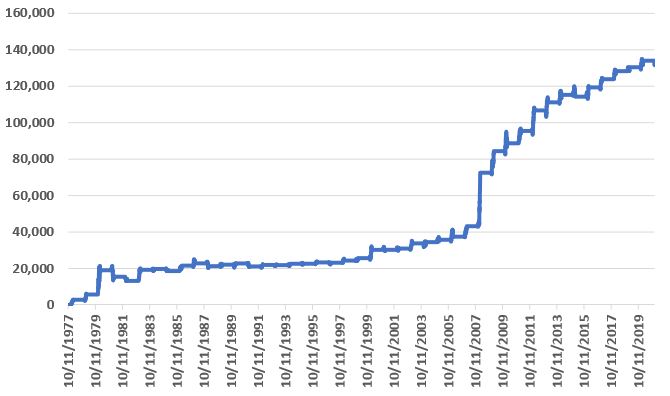
Figure 2 – Cumulative $ +(-) for holding 1-lot of platinum futures during 41-day Favorable Period every year (1978-2020)
Figure 3 displays some relevant facts and figures.
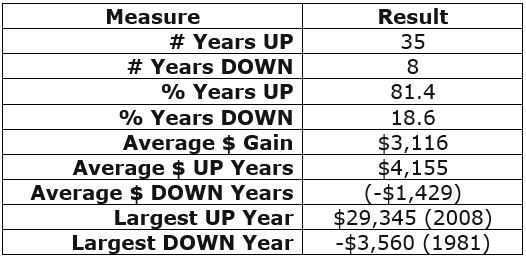
Figure 3 – Facts and Figures
As you can see in Figures 2 and 3:
*This favorable 41 trading day period is “no sure thing”
*However, if you were going to bet on a direction during this period, the bullish side appears to be the better bet
An ETF Alternative
While the above is all very interesting on a theoretical basis, the reality is that a very low percentage of traders will ever touch a platinum futures contract (or should ever touch a platinum futures contract, given the inherent associated risks).
One alternative is to trade shares of ticker PPLT (Aberdeen Standard Physical Platinum Shares ETF). Figure 4 displays the cumulative hypothetical price return for PPLT ONLY during the 41-day favorable period since the ETF was created in 2010.
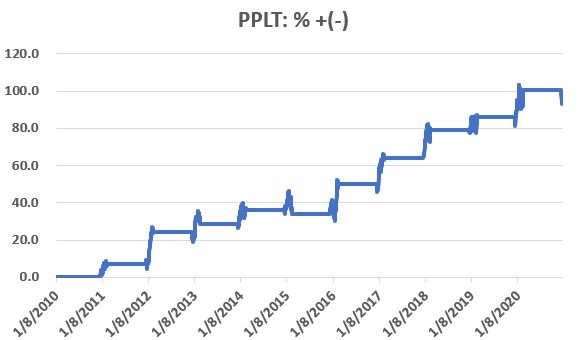
Figure 4 – Cumulative % + (-) for ticker PPLT during Favorable Period
Figure 5 displays the year-by-year results for PPLT during the Favorable Period.
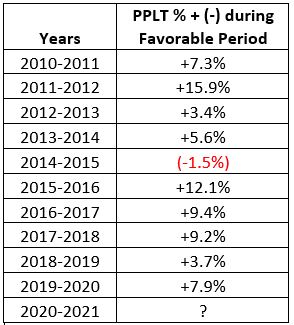
Figure 5 – PPLT %+(-) year-by-year during Favorable Period
During the 1st five trading days of this years “Favorable Period”, PPLT has declined -1.8%.
Summary
The good news about seasonal trends is that they can often afford you an “edge” in the markets. The bad news about seasonal trends is that you never know if a given trend will play out as expected “this time around” – so a certain leap of faith is required.
One’s choices regarding platinum between now and 2/28/2021 are:
*Bet a lot
*Bet a little
*Bet nothing at all
Choose wisely.
Jay Kaeppel
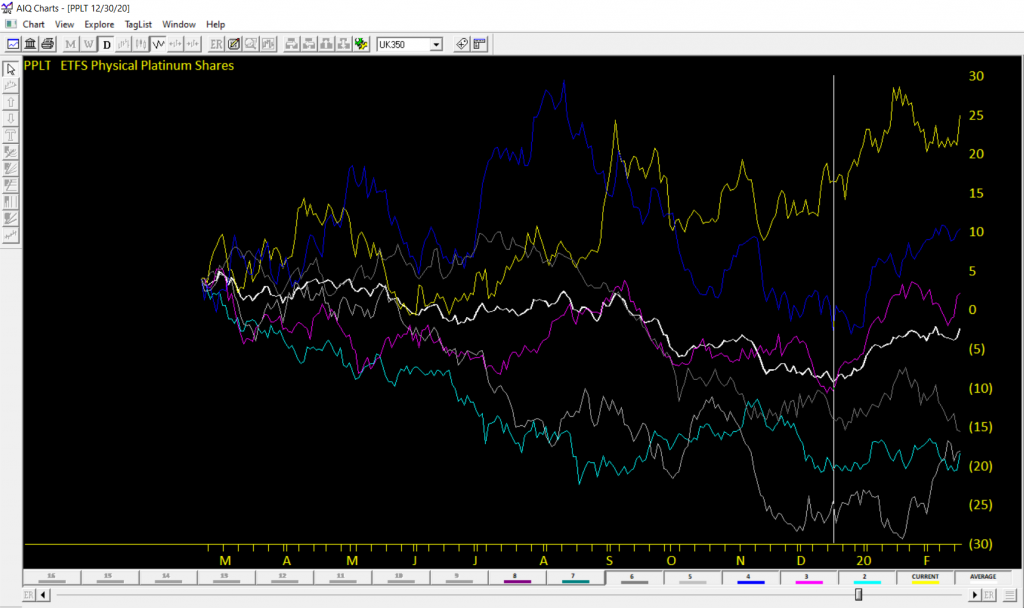
Editor’s note
In this AIQ Seasonality Chart we’ve plotted 6 years price action of PPLT
through February 18, 2020 . The white line is the average of the 6 years and the vertical white is the starting point of the favorable period for each of the 6 years. The favorability of the period 12/17 to 2/18 is evident.
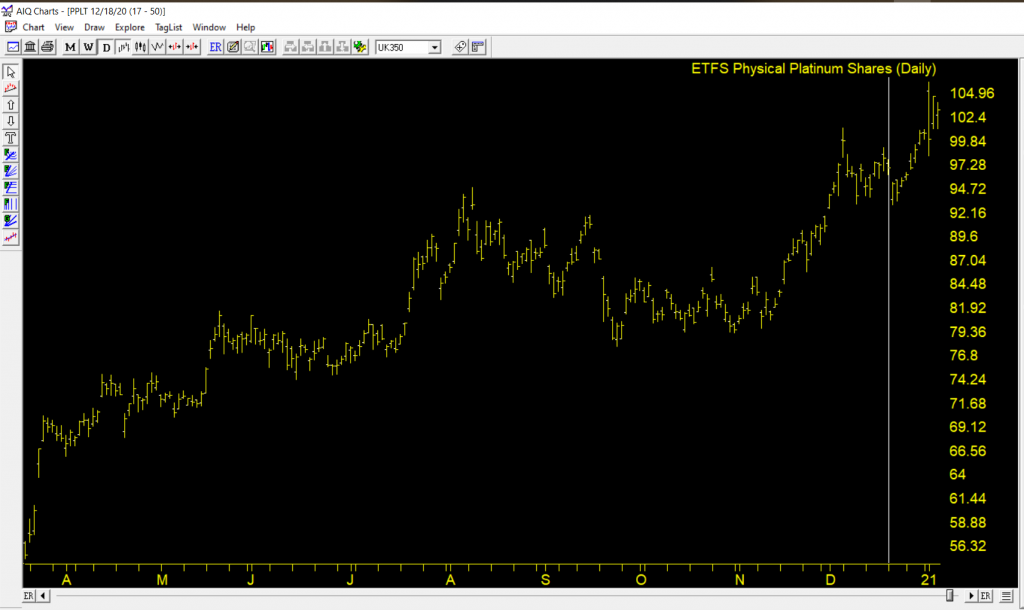
The current chart of PPLT shows the current gain from the favorable start date 12/17/20 at 96.99 to 1/6/21 at 103.22
Disclaimer: The information, opinions and ideas expressed herein are for informational and educational purposes only and are based on research conducted and presented solely by the author. The information presented represents the views of the author only and does not constitute a complete description of any investment service. In addition, nothing presented herein should be construed as investment advice, as an advertisement or offering of investment advisory services, or as an offer to sell or a solicitation to buy any security. The data presented herein were obtained from various third-party sources. While the data is believed to be reliable, no representation is made as to, and no responsibility, warranty or liability is accepted for the accuracy or completeness of such information. International investments are subject to additional risks such as currency fluctuations, political instability and the potential for illiquid markets. Past performance is no guarantee of future results. There is risk of loss in all trading. Back tested performance does not represent actual performance and should not be interpreted as an indication of such performance. Also, back tested performance results have certain inherent limitations and differs from actual performance because it is achieved with the benefit of hindsight.