Category Archives: trading strategy

Markets Rebound: April 29th’s Fibonacci 50% Retracement on QQQ, DJIA, and NASDAQ

After the last few weeks’ market turbulence triggered by escalating tariff headlines, April 2 -28, 2025, delivered a textbook bounce—one that Fibonacci traders could spot a mile away. The QQQ, DJIA, and NASDAQ all staged strong retracements, each pulling back close to the 50% from their recent swing highs to the dramatic lows set by the tariff-driven selloff.

A Closer Look at the 50% Retracement

For those who track Fibonacci levels, the 50% retracement is more than just a number—it often signals a crucial moment of decision in market psychology. It’s the point where bulls and bears reassess their convictions. On April 29, all three major indices touched this level in near-perfect unison.

Let’s break it down:

  • QQQ (Invesco QQQ Trust): After plunging nearly 6% during the tariff turmoil, QQQ bounced back sharply. On 4/29, it retraced exactly 50% of the down move, landing right on the Fibonacci line drawn using AIQ TradingExpert Pro.
  • DJIA (Dow Jones Industrial Average): The Dow’s recovery was equally telling. It reclaimed 50% of the decline from its January high to the low posted on April 7. Resistance formed precisely at this level, adding credibility to the Fibonacci reading.
  • NASDAQ Composite: Tech stocks led the rally, and the NASDAQ showed an aggressive bounce. Like the QQQ, it retraced half the loss, with AIQ TradingExpert Pro’s Fibonacci tool providing a clean visual confirmation of market memory at play.

QQQ and DJIA at the 50% retracement

NASDAQ market at 50% retracement

Using AIQ TradingExpert Pro to Catch the Move

At AIQ, we emphasize practical tools that help traders act, not just analyze. The Fibonacci Retracement tool in AIQ TradingExpert Pro offers an intuitive interface for plotting retracement levels from any significant swing high to low—or vice versa. The 38.2%, 50%, and 61.8% levels are automatically calculated and displayed, making it easy to see where price might hesitate or reverse.

What made April 29 especially notable was how cleanly price respected the 50% level across indices. It wasn’t a vague “zone”—it was a laser line, and those who had it on their charts were better prepared to anticipate resistance and manage risk.

What’s Next?

While the 50% retracement is not a guaranteed reversal point, it is often where institutional players test the bounce’s resolve. If price holds below that level, the odds tilt toward a retest of the recent lows. A strong break above it? Then, we could see a move to the 61.8% level or higher.

With markets still on edge from macro headlines, now’s the time to stay sharp. Fibonacci tools like those in AIQ TradingExpert Pro give traders a clear visual framework, especially during volatile, headline-driven price swings.

Final Thoughts

If you’re not already using Fibonacci levels in your trading, April 29 was a perfect demonstration of their relevance. Whether you’re swing trading or managing a portfolio, these retracement zones offer insight into crowd behavior and price structure. It was noteworthy that the SP500 index had progressed further than 50% retracement (55%)

Stay tuned as we monitor whether this 50% level becomes a ceiling—or just another stepping stone on the road to recovery.

Trading The Channel

AIQ code based on Perry Kaufman’s article in May 2025 issue of Stocks & Commodities, “Trading The Channel,” is shown here and also provided in a downloadable code file. This encodes the system that the author describes as a linear regression slope trading system, which goes long when the linear regression slope goes above the zero line and exits when the linear regression slope drops below the zero line.

! TRADING THE CHANNEL
! Author: Perry J Kaufman, TASC May 2025
! Coded by: Richard Denning, 3/15/2025

! Example of trading the linear regression slope:
Len is 20.
C is [close].
LRslope is Slope2(C,Len).
Signal is iff(LRslope > 0,1,-1).

Buy if Signal = 1 and valresult(Signal,1) = -1.
ExitLong if Signal = -1.

The imagee below shows an example of the linear regression slope line plotted on a daily chart of QQQ (Nasdaq-100 ETF).

Market Timing update 10-28-20

It’s been a couple of months since we last looked at the Market Timing AI Expert System. Since that time the 400 rules that make up this AI system have generated a cluster of 3 down signals, followed by a buy signal and then most recently another down signal.

In this 7 minute video Steve Hill, CEO of AIQ Systems explores the signals and the confirmation techniques used to verfiy the ratings, together with the primary rules that fired.

The VixRSI14 Indicator – Part 2

In this article I detailed an indicator I refer to as VixRSI14 using monthly charts. Today let’s apply the same method to weekly bar charts.  Before we do that a quick look at how this indicator functions.
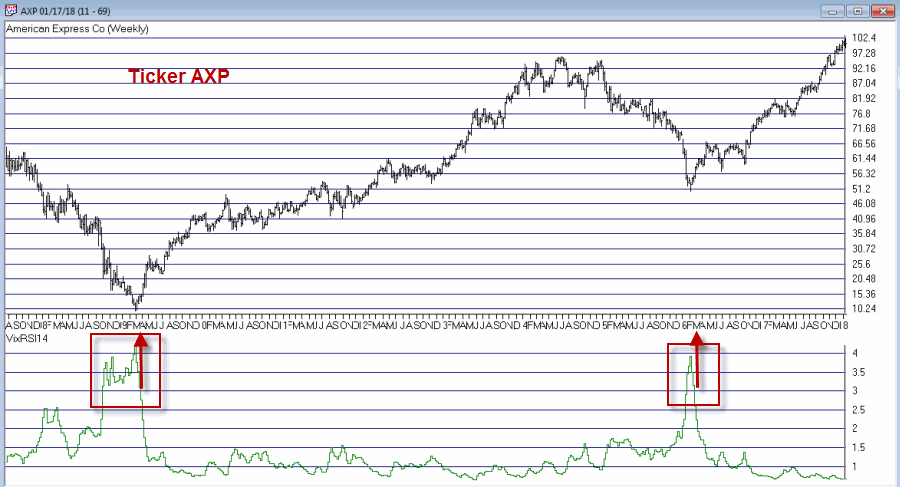
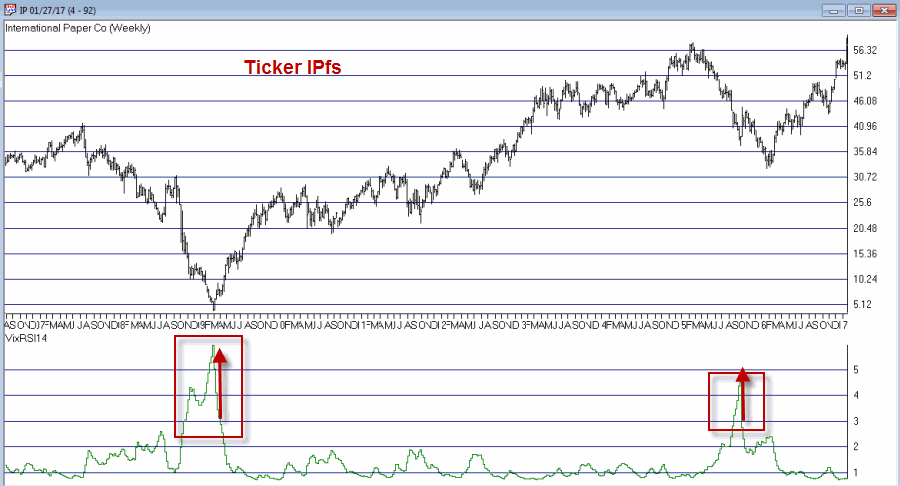
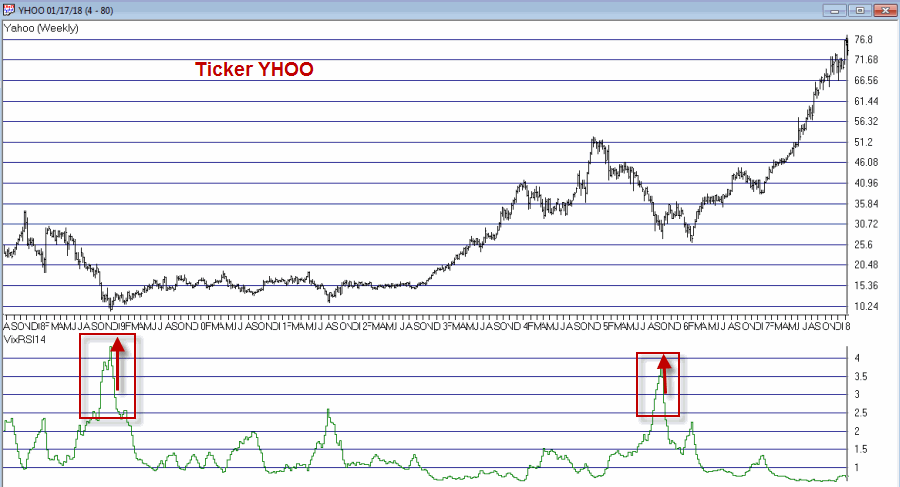
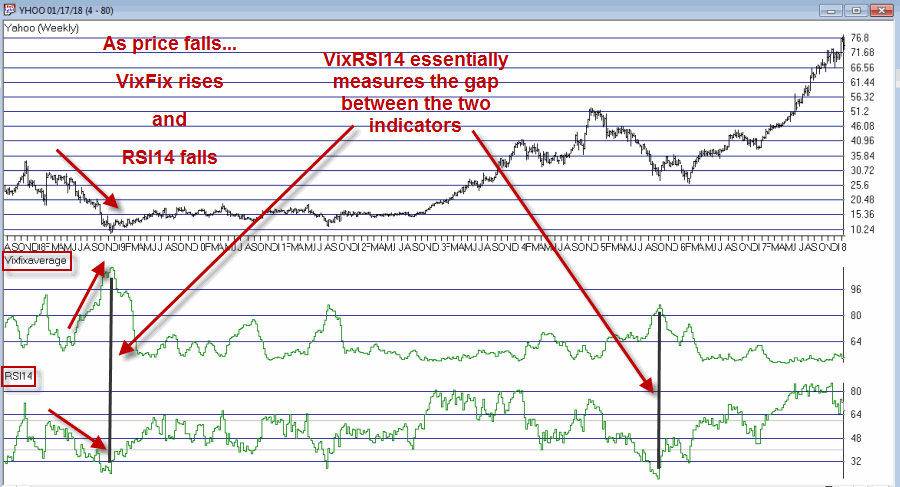
VixRSI combines two indicators – Larry William’s VixFix and Welles Wilder’s Relative Strength Index (RSI).  In Figure 1 you see a weekly bar chart for YHOO.  Notice that as price declines the VixFix indicator rises and RSI falls. VixRSI14 essentially measures the difference between the two and looks for extremes as a sign of a potential reversal. See Figure 5 for YHOO with VixRSI14.
0
Figure 1 – YHOO with Williams VixFix (with 3-day exponential smoothing) and Wilder’s 14-period RSI (Courtesy AIQ TradingExpert)
The Weekly Version of VixRSI14
We will use the same method I described in the previous article, i.e.:
*We will calculate the VixRSI14 indicator (see code at end of article) on a weekly basis
*A “buy alert” occurs when VixRSI14 drops below 3.00 after first rising to 3.50 or higher
Once again, please note that:
*There is nothing magic about 3.50 or 3.00
*Not every “buy alert” is followed by an immediate rally (or even any rally at all for that matter)
*Any actually trading”results” will depend heavily on what you trade, how much of it you trade, when you actually get in, when you get out with a profit and/or when you get out with a loss.
*This VixRSI14 alert signal is simply serving notice that a given security may be overdone on the downside and may be ready soon to reverse to the upside.  Nothing more, nothing less.1
Figure 2 – AAPL(Courtesy AIQ TradingExpert)
2
Figure 3 – AXP (Courtesy AIQ TradingExpert)
3
Figure 4 – IP (Courtesy AIQ TradingExpert)
4
Figure 5 – YHOO (Courtesy AIQ TradingExpert)
Summary
In 2018 I intend to try to share a few more trading “ideas” that maybe are not quite “finished products”.  VixRSI14 fits neatly into the “Idea” category. Sometimes the alerts are early.  Sometimes the alerts are late.  Sometime the alerts don’t really pan out at all.  Sometimes alerts are followed by one more sharp decline which is then followed by a major rally. So maybe some sort of trend reversal confirmation would be helpful.  I don’t know.
Hey, that gives me an idea….
Code:
William’s VixFix is simply the 22-period high price minus today’s low price divided by the 22-day period price (I then multiply by 100 and then add 50).  That may sound complicated but it is not.
The code for AIQ TradingExpert appears below.
########## VixFix Code #############
hivalclose is hival([close],22).
vixfix is (((hivalclose-[low])/hivalclose)*100)+50.
###############################
####### 14-period RSI Code ###########
Define periods14 27.
U14 is [close]-val([close],1).
D14 is val([close],1)-[close].
AvgU14 is ExpAvg(iff(U14>0,U14,0),periods14).
AvgD14 is ExpAvg(iff(D14>=0,D14,0),periods14).
RSI14 is 100-(100/(1+(AvgU14/AvgD14))).
###############################
VixRSI14 is then calculated by dividing the 3-period exponential average of VixFix by the 3-period exponential average of RSI14
####### VixRSI14 Code ###########
VixRSI14 is expavg(vixfix,3)/expavg(RSI14,3).
###############################
Jay Kaeppel
Disclaimer:  The data presented herein were obtained from various third-party sources.  While I believe the data to be reliable, no representation is made as to, and no responsibility, warranty or liability is accepted for the accuracy or completeness of such information.  The information, opinions and ideas expressed herein are for informational and educational purposes only and do not constitute and should not be construed as investment advice, an advertisement or offering of investment advisory services, or an offer to sell or a solicitation to buy any security.

Trend or Countertrend? Why Not Both?

First the brutal disclaimers: What follows is NOT a trading “system.” It is merely an “idea.” Even more brutally, I can’t even claim that it “works”.  All the testing I have done so far is more anecdotal. Also to an extremely huge degree, the actual entry trigger and exit trigger that  trader might choose to use will have – as always – at least as much if not more impact on overall trading results as the actual “alert” signal detailed below.
Got that?  OK, then let’s proceed.
The Debate
The ongoing debate in trading is always – trend-following or countertrend?  Which is the way to go?  There are (conservatively) at least a bazillion and one ways to argue one way or the other.       Figure 1 displays ticker TXN with upper and lower “Acceleration Bands” (code for AIQ TradingExpert appears after disclaimer at end of article) drawn.
1
Figure 1 – Ticker TXN with Acceleration Bands (Courtesy AIQ TradingExpert)
Want to start a debate?  Ask this question: Is it better to buy when price hits the upper band or the lower band?  Sometimes price hits the upper band and just keeps going.  Sometimes it hits the upper band and the move peters out and reverses fairly quickly.
Going with the trend can lead to some big winning trades along the way, but typically involves a lot of whipsaws as well. Trading countertrend can lead to some great, quick profits – expect of course for when the initial trend never quite reverses and quick losses accrue instead.
What to do, what to do?
So the “idea” I mentioned at the outset generally goes like this:
*In an uptrend (which we will define in a moment)
*Wait for price to hit the Upper Band
*Then wait for a pullback
*Then wait for the uptrend to reassert itself
Got that? OK, me neither exactly.  So let’s try to define things a little more clearly.
1. As long as the closing price remains above the 200-day moving average, we will call that an “uptrend”
2. Within an uptrend wait for the high of a trading day to reach or exceed the Upper Acceleration Band.
3. Following #2, wait for the 4-day RSI to drop to 32 or lower with the following caveats:
*If price touches the Lower Acceleration Band OR closes below the 200-day moving average
*Then the setup is invalidated
This is the “Setup”.  For sake of example I will add an entry trigger as follows:
4. Following a valid #3 Alert Signal, buy when price exceeds the previous day’s high
I am going to purposely NOT add an exit trigger – just so that no one decides to “try it out” without at least giving it some thought on their own.
So Figure 2 shows the “Alerts” and “Entry Triggers” for the chart in Figure 1.
2Figure 2 – Ticker TXN with Example “Entry Triggers” (Courtesy AIQ TradingExpert)
So Figure 3 shows the “Alerts” and “Entry Triggers” for ticker EBAY3
Figure 3 – Ticker EBAY with Example “Entry Triggers” (Courtesy AIQ TradingExpert)
So Figure 4 shows the “Alerts” and “Entry Triggers” for ticker CSCO
4
Figure 4 – Ticker CSCO with Example “Entry Triggers” (Courtesy AIQ TradingExpert)
So are these signals any good? Well, like a lot of trading methods, some look pretty good and others do not.  As I also mentioned earlier, a lot depends on the method or methods you use to exit each trade.
Summary
The reality is that there is a chance that the “idea” contained herein is just no darn good.
But also remember that there are other “trend filters” (besides the 200-day moving average), there are other “bands” (besides Acceleration Bands”), there are other oversold indicators (besides 4-day RSI) and there are other entry and exit triggers.
As such, this piece is essentially for people who are willing to do a little digging on their own and, a) become comfortable (or not) with the idea, and b) develop  some position sizing, stop-loss and profit-taking criteria.
Jay Kaeppel
Disclaimer:  The data presented herein were obtained from various third-party sources.  While I believe the data to be reliable, no representation is made as to, and no responsibility, warranty or liability is accepted for the accuracy or completeness of such information.  The information, opinions and ideas expressed herein are for informational and educational purposes only and do not constitute and should not be construed as investment advice, an advertisement or offering of investment advisory services, or an offer to sell or a solicitation to buy any security.
Acceleration Bands Code for AIQ Expert Design Studio EDS
a is ([high]-[low]).
b is ([high]+[low])/2.
c is (a / b).
d is (c*2).
e is (1+d).
f is (1-d).
g is ([high]*e).
h is ([low]*f).
AccelUB is Simpleavg(g, 20).
AccelLB is Simpleavg(h, 20).