In this update, we’ll take a look at the current AI signals on the Dow Jones. For folks less familiar with our AI engine here’s a recap of what we do.
TradingExpert Pro uses two AI knowledge bases, one specifically designed to issue market timing signals and the other designed to give stock timing signals.
Each contains approximately 400 rules, but only a few “fire” on any given day. In the language of expert systems, those rules that are found to be valid on a particular day are described as having “fired”.
Rules can fire in opposite directions. When this happens, the bullish and bearish rules fight it out. It’s only when bullish rules dominate that the Expert Rating signal is bullish, or when bearish rules dominate that the Expert Rating signal is bearish.
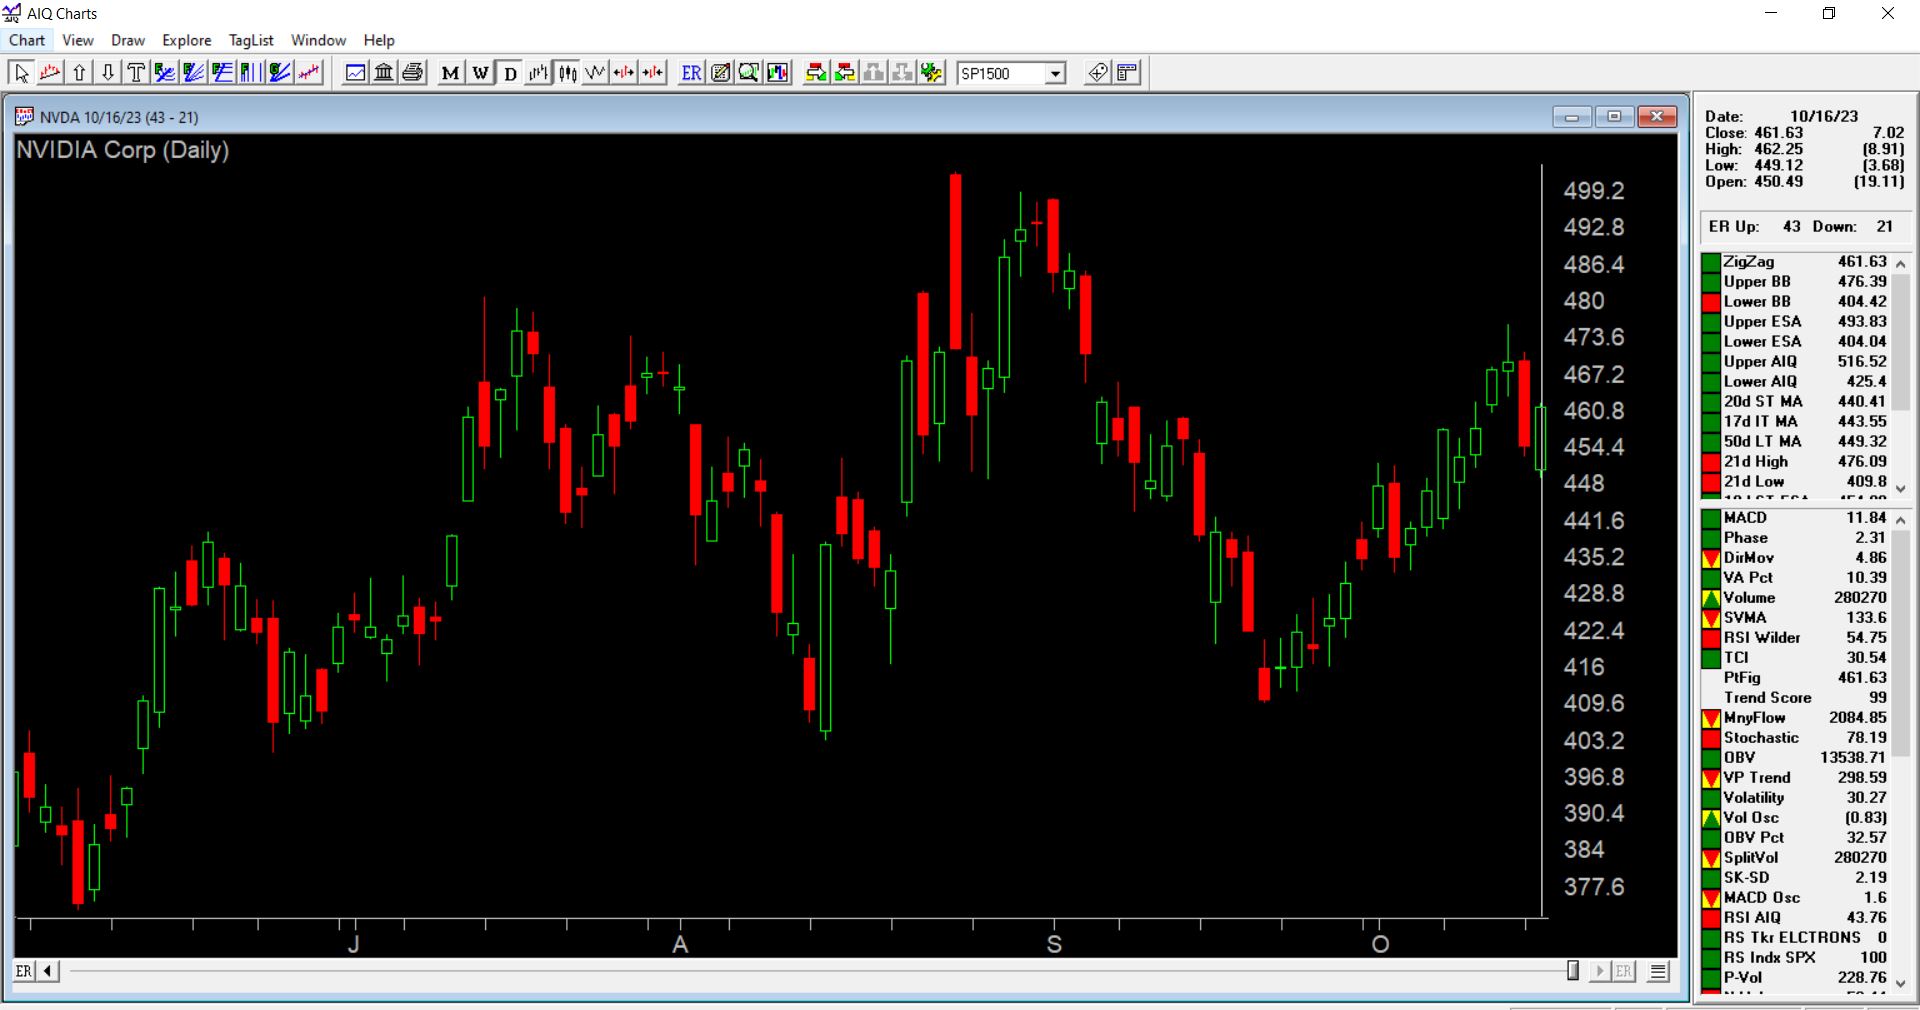
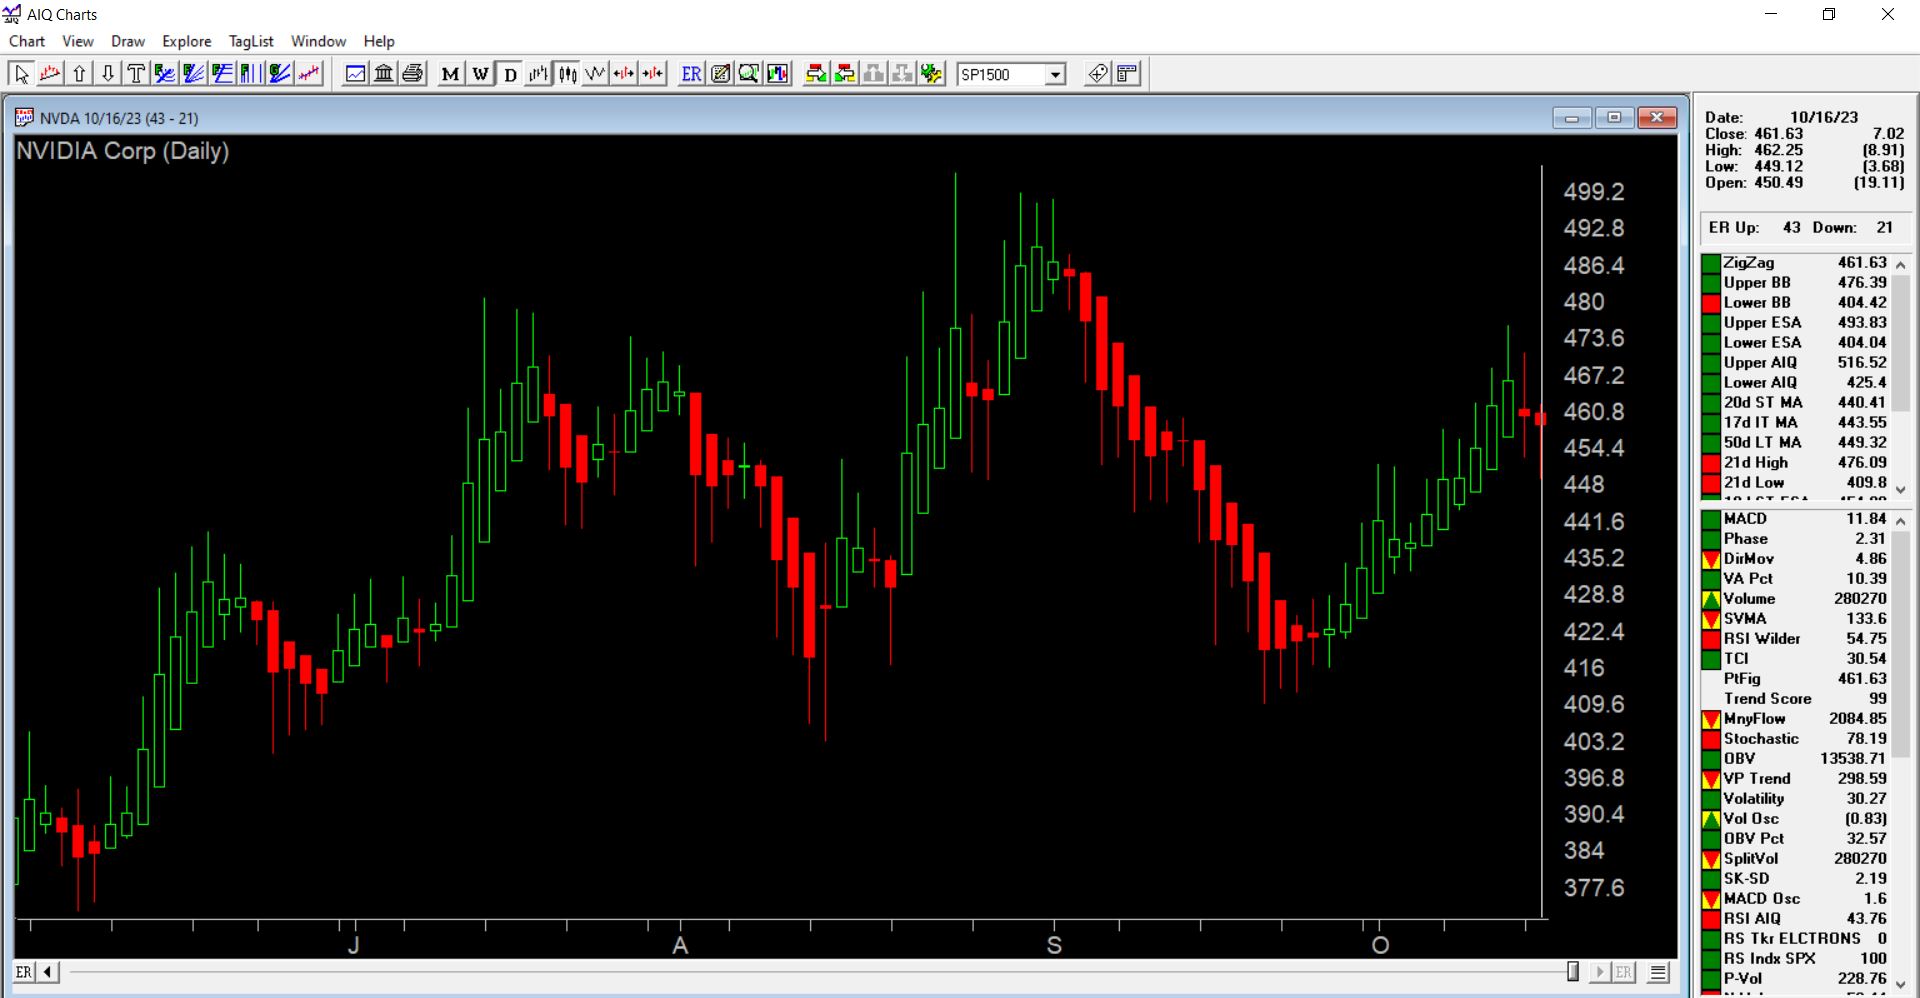
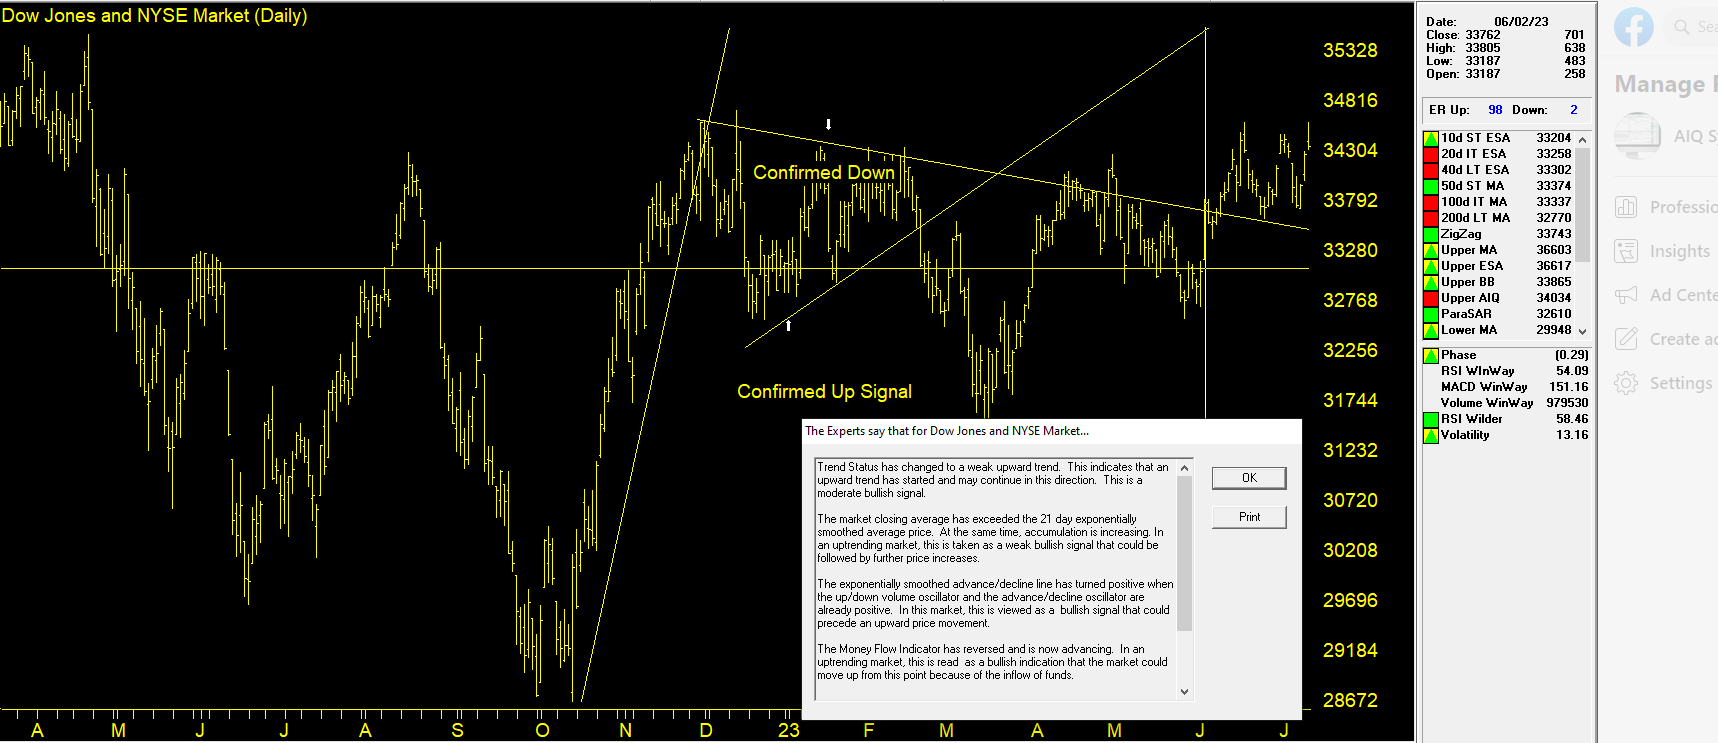
The Expert Rating consists of two values.
The upside rating is the value on the left and the downside rating is on the right. Expert Ratings are based on a scale of 0 to 100. An Expert Rating of 95 to 100 is a strong signal that the Stock or market may change direction.
An Expert Rating below 90 is considered meaningless. A low rating means that there is not enough consistency in the rules that are fired to translate to a signal. The expert system has insufficient evidence to warrant a change from the last strong signal.
The Expert Desogn Studio file mentioned in this video is available to download here