Most people are familiar with ADHD, manic-depressive disorder, depression and schizophrenia. But one common affliction within our trading community that gets almost no attention is WESS. That stands for “Wild-Eyed Speculation Syndrome”. And it’s more common than you think (“Hi, my name is Jay”).
The exact symptoms vary, but generally speaking they go something like this:
*A person gets up in the morning with a hankering to make a trade
*Said person then finds “some reason” to make some trade in something
*If the person happens to make money on that trade then the affliction is reinforced by virtue of IGTS (“I’ve Got the Touch Syndrome”, which is one of the occasional side effects of WESS)
*If the person loses money on the trade the side effects can vary but may include: angry outbursts, kicking oneself in the head (typically figuratively), vows to either stop the behavior or at least do it better, and so on.
*The most common side effect of WESS is a declining trading account balance (which not coincidentally is how this disorder is most commonly diagnosed).
For those suffering from WESS – with the caveat/disclosure that I am not a medical professional (although I have found that ibuprofen really clears up a lot of stuff, but I digress) – I am here to help.
If you find yourself suffering from Symptom #1 above:
The most effective step is to go back to bed until the urge passes. If this doesn’t work or is not possible (for instance, if you have one of those pesky “jobs” – you know, that 8-hour a day activity that gets in the way of your trading), repeat these two mantras as many times as necessary:
Mantra 1: “I must employ some reasonably objective, repeatable criteria to find a trade with some actual potential”
Mantra 2: “I will risk no more than 2% of my trading capital” on any WESS induced trade (and just as importantly, you must fend off the voice on the other shoulder shouting “But this is the BIG ONE!!”)
Repeat these mantras as many times as necessary to avoid betting the ranch on some random idea that you “read about on the internet, so it must be true.”
Regarding Mantra 1
There are a million and one ways to find a trade. There is no one best way. But just to give you the idea I will mention one way and highlight a current setup. IMPORTANT: That being said, and as always, I DO NOT make recommendations on this blog. The particular setup I will highlight may work out beautifully, or it may be a complete bust. So DO NOT rush out and make a trade based on this just because you read it – you know – on the internet.
The Divergence
Lots of trades get made based on “divergence”. In this case we are talking about the divergence between price and a given indicator – or even better, series of indicators. There is nothing magic about divergence, and like a lot of things, sometimes it works and sometimes it doesn’t. But the reason it is a viable consideration is that when an indicator flashes a bullish divergence versus price it alerts us to a potential – nothing more, nothing less – shift in momentum.
Let’s look at ticker GDX – an ETF that tracks an index of gold mining stocks. In Figure1 1 through 4 below we see:
*GDX price making a lower low
*A given indicator NOT confirming that new low (i.e., a positive divergence)
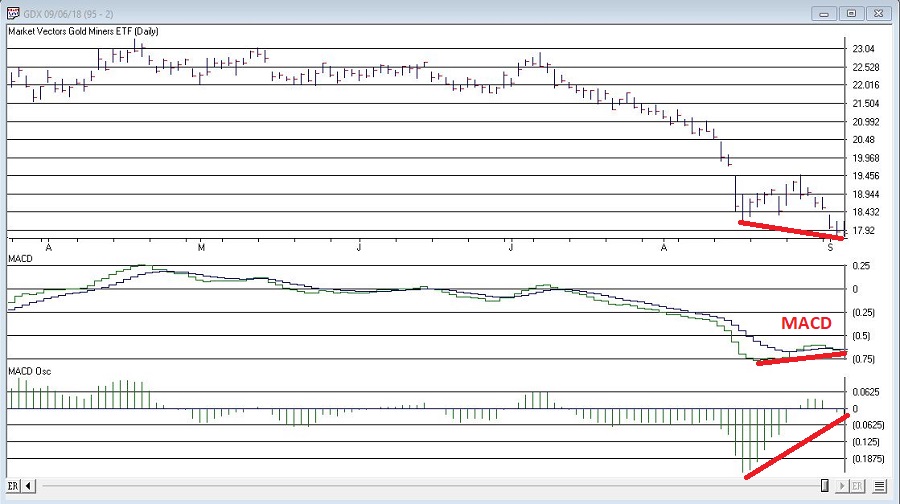 Figure 1 – GDX and MACD (Courtesy AIQ TradingExpert)
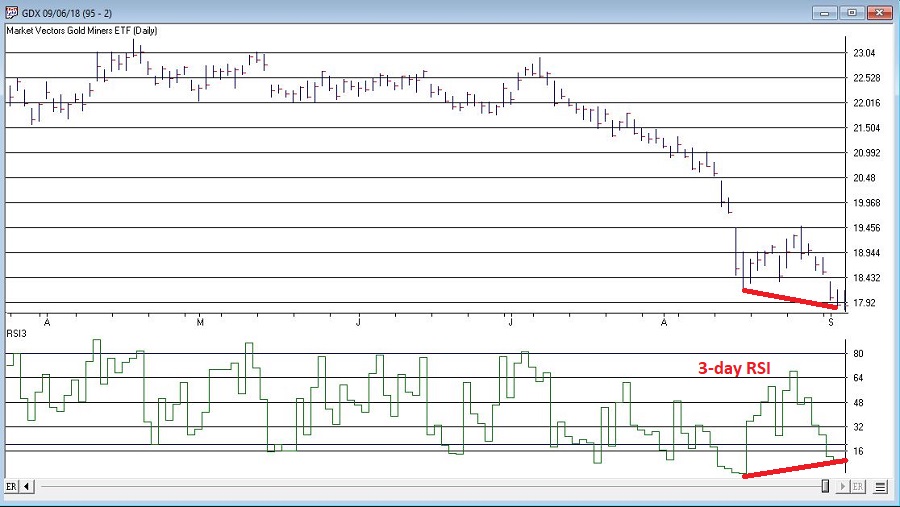 Figure 2 – GDX and 3-day RSI (Courtesy AIQ TradingExpert)
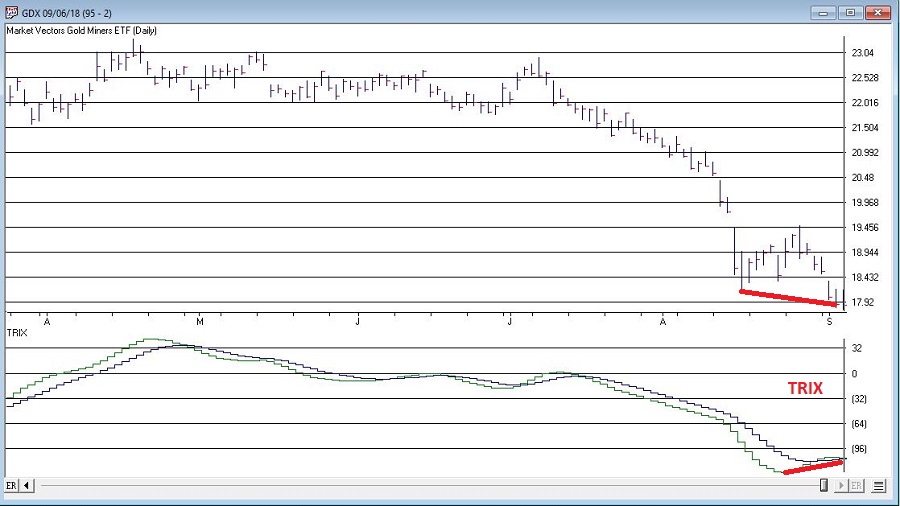 Figure 3 – GDX and TRIX (Courtesy AIQ TradingExpert)
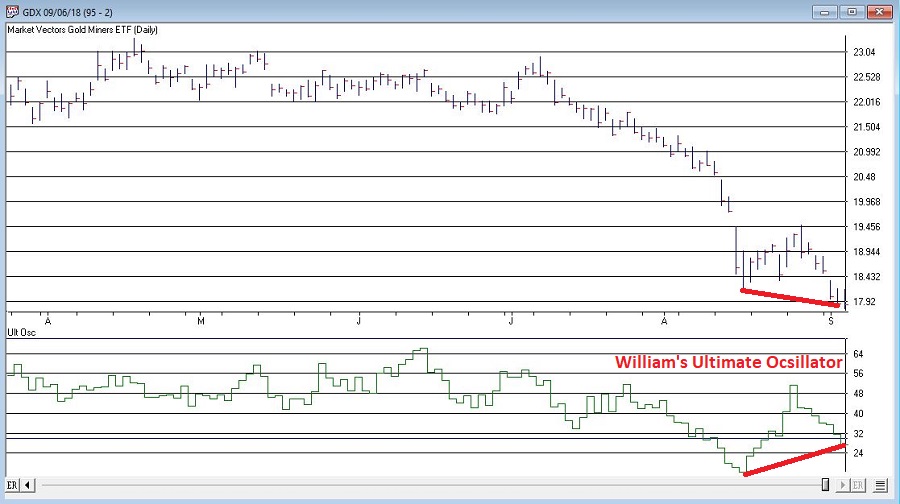 Figure 4 – GDX and William’s Ultimate Oscillator (Courtesy AIQ TradingExpert)
So, do the divergences that appear in Figures 1 through 4 justify a trade? Well, here is where the aforementioned affliction comes into play.
Average Trader: “Maybe, maybe not. In either case I am not entirely sure that trying to pick a bottom in gold stocks based solely on indicator divergences is a good idea”
WESS Sufferer: “Absofreakinglutely!! Let’s do this!!”
You see the problem.
So, let’s assume that a WESS Sufferer likes what he or she sees in Figures 1 through 4. The good news is that we have met the minimum criteria for Mantra #1 above – we have employed some reasonably objective, repeatable criteria (i.e., a bullish divergence between price and a number of variable indicators) to spot a potential opportunity.
Now we must follow Mantra #2 of risking no more than 2% of my trading capital. Let’s assume our WESS Sufferer has a $25,000 trading account. So he or she can risk a maximum of $500 ($25,000 x 2%).
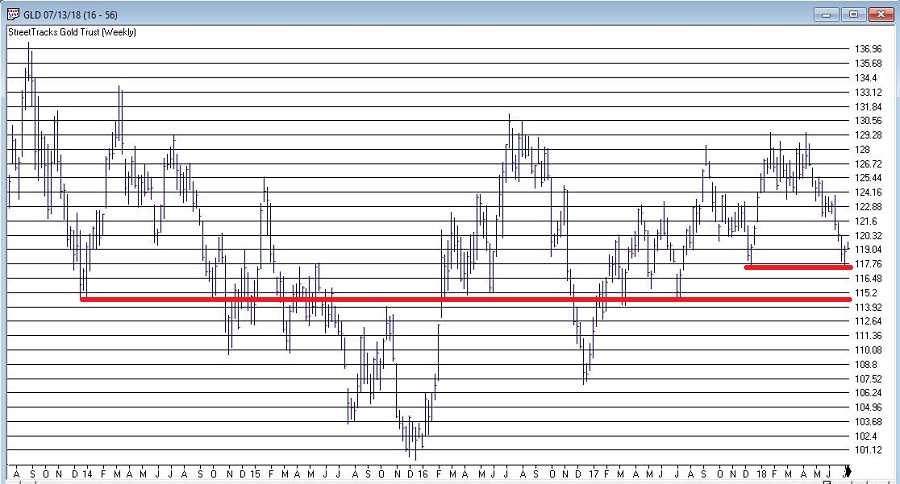
In Figure 5 we see a potential support area for GDX at around $16.40 a share.
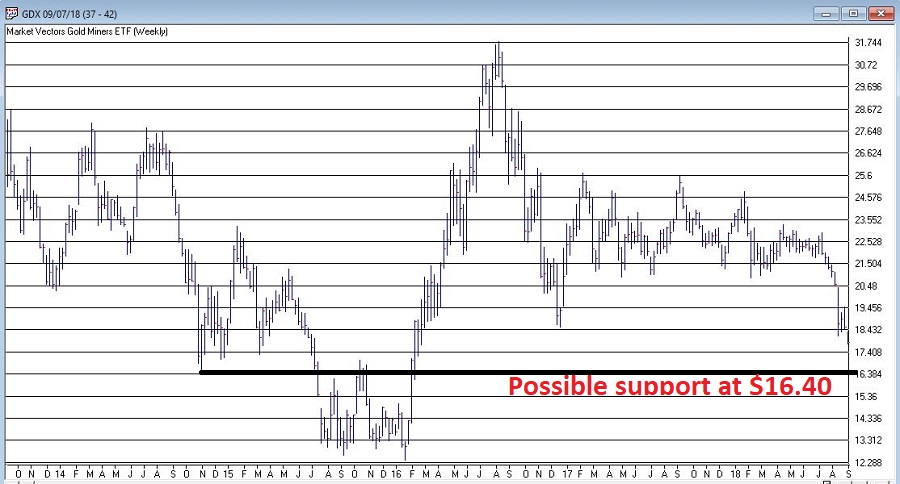 Figure 5 – Ticker GDX with support at $16.40 (Courtesy AIQ TradingExpert)
So, one possibility would be to buy 300 shares of GDX at $17.84 and place a stop loss order below the “line in the sand” at say $16.34 a share. So if the stop is hit, the trade would lose -$450, or -1.8% of our trading capital (17.84 – 16.34 = -1.50 x 300 shares = -$450).
Summary
Does any of the above fit in the category of “A Good Idea”. That’s the thing about trading – and most things in life for that matter – it’s all in the eye of the beholder. Remember, the above is NOT a “recommendation”, only an “example.”
The real key thing to note is that we went from being just a random WESS Sufferer to a WESS Sufferer with a Plan – one that has something other than just an “urge” to find a trade, AND (most importantly) a mechanism for limiting any damage that might be done if things don’t pan out.
And if that doesn’t work, well, there’s always ibuprofen.
Jay Kaeppel
Disclaimer: The data presented herein were obtained from various third-party sources. While I believe the data to be reliable, no representation is made as to, and no responsibility, warranty or liability is accepted for the accuracy or completeness of such information. The information, opinions and ideas expressed herein are for informational and educational purposes only and do not constitute and should not be construed as investment advice, an advertisement or offering of investment advisory services, or an offer to sell or a solicitation to buy any security.