I’ve been seeing a number of panicked missives lately regarding the retailing sector. They typically go something like this:
“Despite new highs for most of the major market indexes, the retailing sector has been struggling – and in some cases hit hard – therefore it is clearly (paraphrasing here) THE END OF THE WORLD AS WE KNOW IT, AHHHHHHHHHHHHH……………………..”
Or something along those lines. And the truth is that they may be right. But as it turns out, with the retailing sector it is typically more a question of “when” and not “what” (or even WTF
Recent Results
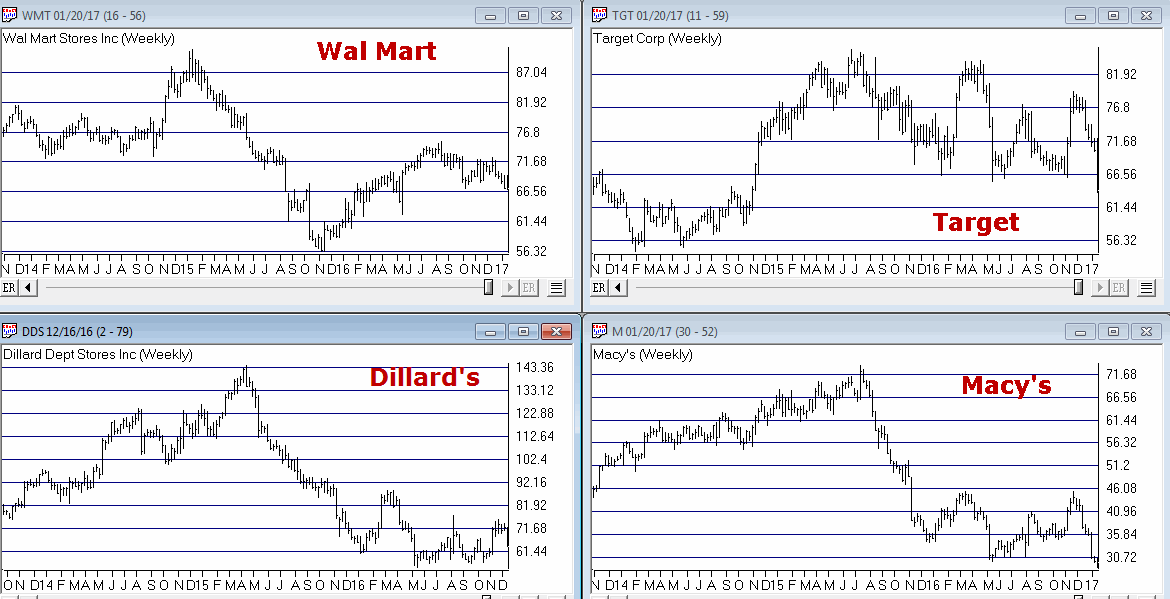
The concerns alluded to above are understandable given recent results in certain segments of the retailing sector. Figure 1 displays the stock price action for four major retailers. It isn’t pretty.
(click to enlarge)
Figure 1 – Major retailers taking a hit (Chart courtesy AIQ TradingExpert)
So if major retailers are performing poorly one can certainly see why someone might extrapolate this to conclude that the economy is not firing on all cylinders and that the recent rally to new highs by the major averages is just a mirage. And again, that opinion may ultimately prove to be correct this time around.
But before swearing off of retailing stocks, consider the following.
Retailers – When not What
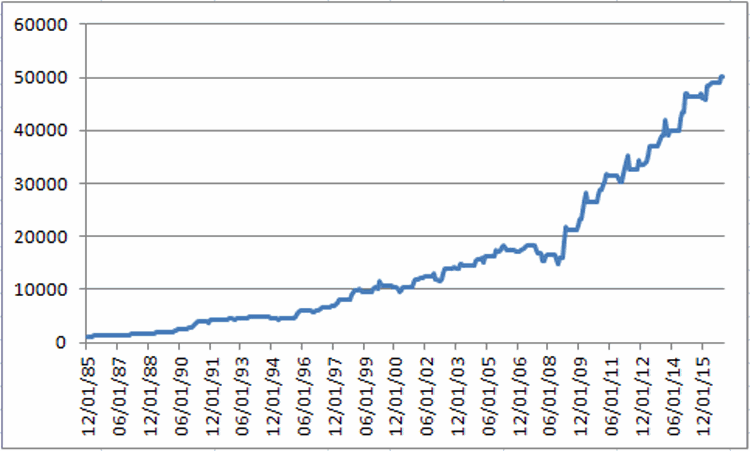
For our test we will use monthly total return data for the Fidelity Select Retailing sector fund (ticker FSRPX). Figure 2 displays the growth of $1,000 invested in FSRPX only during the months of:
*February, March, April, May, November, December
Figure 2 – Growth of $1,000 invested in ticker FSRPX only during the “favorable” months since 1986
For the record:
*An initial $1,000 grew to $50,274, or +4,927% (this test does not include any interest earned during the months out of FSRPX).
*# of years showing a net gain = 27
*# of years showing a net loss = 4
*Average UP year = +17.0%
*Average DOWN year = (-3.4%)
*Maximum UP Year = +50.0% (1990)
*Maximum DOWN Year = (-5.9%) (1994)
The Year-by-Year Results appear in Figure 3
| Year | % +(-) |
| 1986 | 26.2 |
| 1987 | 15.8 |
| 1988 | 12.2 |
| 1989 | 16.9 |
| 1990 | 50.0 |
| 1991 | 45.5 |
| 1992 | 8.0 |
| 1993 | 4.6 |
| 1994 | (5.9) |
| 1995 | 3.0 |
| 1996 | 26.1 |
| 1997 | 18.1 |
| 1998 | 45.7 |
| 1999 | 4.0 |
| 2000 | 1.8 |
| 2001 | 12.5 |
| 2002 | (0.1) |
| 2003 | 18.5 |
| 2004 | 11.3 |
| 2005 | 10.3 |
| 2006 | 0.1 |
| 2007 | (2.8) |
| 2008 | (4.7) |
| 2009 | 44.9 |
| 2010 | 24.5 |
| 2011 | 4.6 |
| 2012 | 10.8 |
| 2013 | 16.6 |
| 2014 | 11.5 |
| 2015 | 6.1 |
| 2016 | 9.2 |
Figure 3 – Year-by-Year Results for “Favorable” Months since 1986
The Rest of the Year
If for some reason you had decided to skip the months above and hold FSRPX only during all of the other months of the year, your results appear in Figure 4.

Figure 4 – Growth of $1,000 invested in ticker FSRPX only during the “unfavorable” months since 1986
For the record:
*An initial $1,000 grew to $1,037, or +3.7% (this test does not include any interest earned during the months out of FSRPX).
Summary
Is the retailing sector guaranteed to generate a gain during our “favorable” months in 2017? Not at all. Still, given that retailing is presently beaten down a bit and the fact that the worst full year loss during the favorable months was -5.9%, it may be time to think about taking a look (although – as always, and for the record – I am not “recommending” retailing stocks, only pointing out the historical trends).
Still, as the old saying goes, the results below are what we “quantitative types” refer to as “statistically significant”.
*Favorable months since 1986 = +4,927%
*Unfavorable months since 1986 = +3.7%
Jay Kaeppel
Chief Market Analyst at JayOnTheMarkets.com and AIQ TradingExpert Pro (http://www.aiqsystems.com) client. http://jayonthemarkets.com/
Chief Market Analyst at JayOnTheMarkets.com and AIQ TradingExpert Pro (http://www.aiqsystems.com) client. http://jayonthemarkets.com/


