The AIQ code based on Vitali Apirine’s article in the September issue of Stocks and Commodities, “Weekly and Daily Stochastics, is provided below
Using Apirine’s weekly and daily stochastic indicators and a moving average to determine trend direction, I created an example system (long only) with the following rules:
Enter long next bar at open when all of the following are true:
- The 200-day simple average of the NDX is greater than the day before
- The 200-day simple average of the stock is greater than the day before
- Both the weekly and daily stochastic indicators have been below 20 in the last five days
- Both the weekly and daily stochastic indicators are greater than the day before.
I tested three exits. Figure 8 shows a 21-day hold then exit. Figure 9 shows a three-moving-average trend-following exit. Figure 10 shows an exit using only the weekly & daily stochastic, once both are lower than the day before.

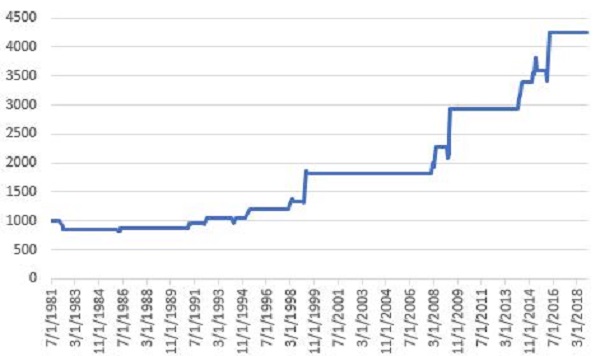
FIGURE 8: AIQ, BUY and HOLD. Here is the sample equity curve (blue) compared to the NDX (red) for the test using a 21-day hold exit.

FIGURE 9: AIQ, TREND-FOLLOWING EXIT. Here is the sample equity curve (blue) compared to the NDX index (red) for the test using a trend-following exit.

FIGURE 10: AIQ, W and D STOCHASTIC EXIT. Here is the sample equity curve (blue) compared to the NDX index (red) for the test using the weekly and daily stochastic indicators.
The 21-day hold test showed a 11.2% return with a maximum drawdown of 29.3%. The trend-following exit test showed a 17.6% return with a maximum drawdown of 28.8%. The test using an exit based on only the weekly and daily stochastic indicators showed a return of 2.9% with a maximum drawdown of 32.5%. All the tests used the same entry rule and were run on an old 2016 list of the NASDAQ 100 stocks with the stocks that are no longer trading deleted.
!WEEKLY AND DAILY STOCHASTIC
!Author: Vitali Apirine, TASC Sept 2018
!Coded by: Richard Denning 7/7/2018
!www.TradersEdgeSystems.com

!INPUTS:
Periods is 14.
Periods1 is 3.
Pds is 70.
Pds1 is 3.
smaLen1 is 70.
exitType is 1.

!ABBREVIATIONS:
C is [close].
H is [high].
L is [low].

!INDICATOR CODE:
STOCD is (C-LOWRESULT(L,Periods))/(HIGHRESULT(H,Periods)-LOWRESULT(L,Periods))*100.
SD is Simpleavg(Stocd,Periods1).
StocW is (C-LOWRESULT(L,Pds))/(HIGHRESULT(H,Pds)-LOWRESULT(L,Pds))*100.
SW is Simpleavg(Stocw,Pds1).
HD if hasdatafor(1000) >= 500.
SMA200 is simpleavg(C,200).
SMA200ndx is tickerUDF("NDX",SMA200).

!SYSTEM CODE:
Buy if SMA200ndx > valresult(SMA200ndx,1)
          and SMA200 > valresult(SMA200,1)
          and SW > valresult(SW,1)
          and SD > valresult(SD,1)
          and countof(SW < 20,5)>=1
          and countof(SD < 20,5)>=1
          and HD.
smaLen2 is smaLen1*2.
smaLen3 is smaLen1*4.
SMA1 is simpleavg(C,smaLen1).
SMA2 is simpleavg(C,smaLen2).
SMA3 is simpleavg(C,smaLen3).
PD is {position days}.

!EXIT TYPE 1 USES THE INDICATOR ONLY
!EXIT TYPE 2 IS TREND FOLLOWING
Sell if (SD < valresult(SD,1) and SW < valresult(SW,1) and exitType=1)
       or (exitType = 2
           and ((Valresult(C,PD)valresult(SMA1,PD) And Cvalresult(SMA2,PD) And Cvalresult(SMA3,PD) And C 250)).

RSS is C/valresult(C,120).
RSL is C/valresult(C,240).