First the Good News:
*The market averages are still in an up trend
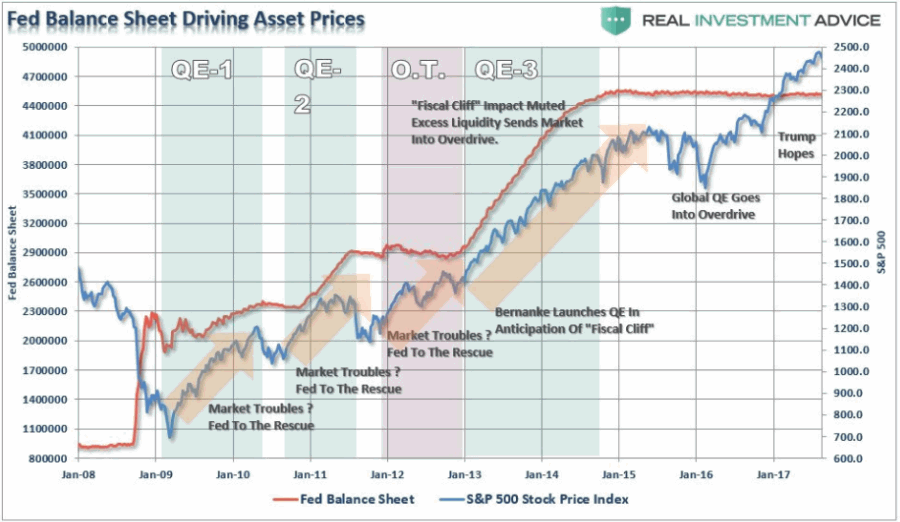
*The Fed has yet to “remove the punch bowl”
Figure 1 – Major Averages still in Up Trends (Courtesy AIQ TradingExpert)
Figure 2 – Fed Quantitative Easing propels the stock market (Courtesy RealInvestmentAdvice.com)
Now the bad news
Market Bellwethers Flashing Warnings
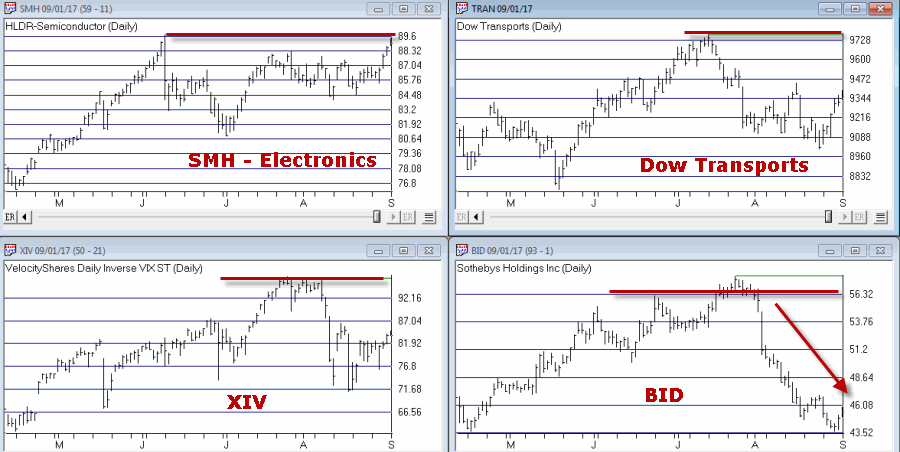
In this article I wrote about four tickers I follow for signs of early warnings of trouble. At the moment, all four are flashing warnings.
Figure 3 – Bellwethers flashing potential warnings (Courtesy AIQ TradingExpert)
Stocks are Extremely Overvalued
Something important to note: valuation indicators are NOT good timing indicators. The overall market can be over or undervalued for years. However, overvalued valuation readings are extremely reliable at telling us what will come next once the top is in (whenever that may be). Figure 4 displays the Schiller CAPE model which measures adjusted P/E ratio.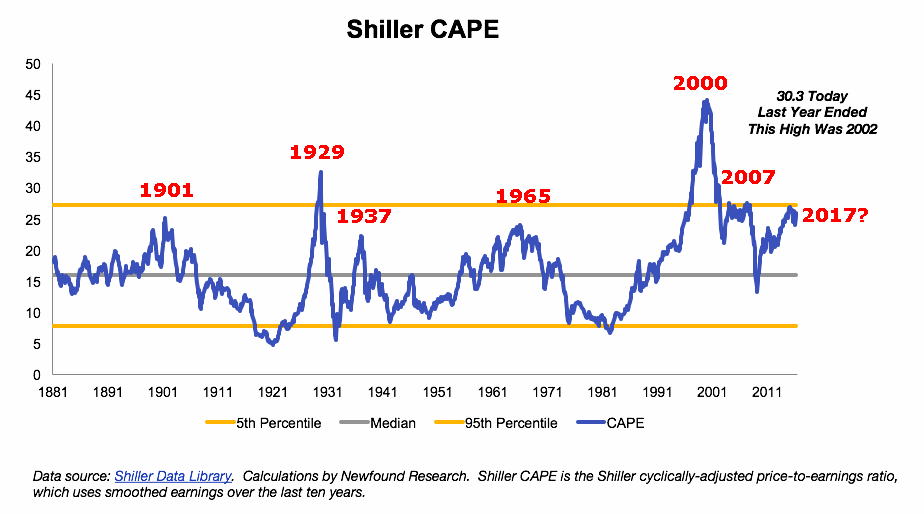 Figure 4 – Schiller Adjusted PE (Courtesy: Schiller Data Library)
 Figure 4 – Schiller Adjusted PE (Courtesy: Schiller Data Library)
1901: Dow -37% in 32 months
1929: Dow -89% in 3 years
1932: Dow -49% in 13 months
1965: Dow sideways to 40% lower for 17 years
2000: Nasdaq 100 -87%
2007: Dow -55% in 17 months
2017: ??
When will the exact top form? Don’t know
What will likely follow? Don’t Ask
The Decennial Pattern
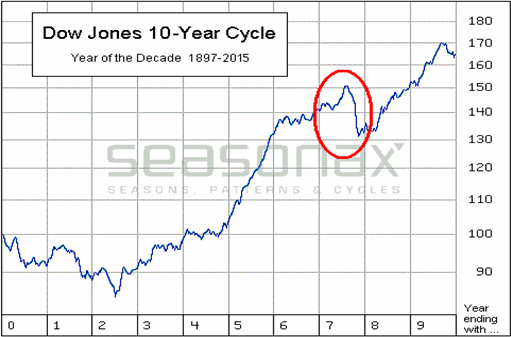
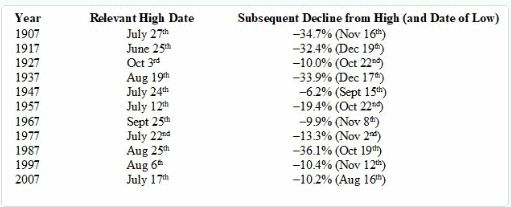
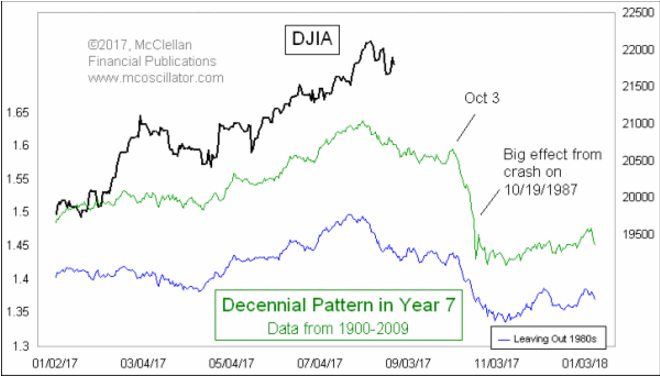
As I wrote about here and as you can see in Figures 5 and 6, the Year 7 into Year 8 period has historically witnesses significant market weakness. That does not mean that that is what will happen this time around. But it is reason for caution.
Figure 5 – Stock Market Decennial Pattern (Courtesy: OptionStrategist.com)
Figure 6 – Trouble in Late Year “7” (Courtesy: OptionStrategist.com)
Figure 7 from Tom McLellan illustrates this phenomenon even more clearly.
Figure 7 – Trouble in Late Year “7” (Courtesy: www.mclellanoscillator.com)
September
What a crummy time for September to roll around. Figure 8 displays the fact that the Dow has lost -80% during the month of September since 1897.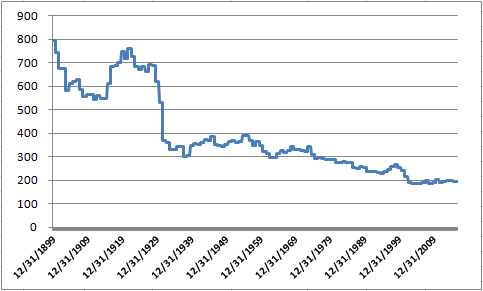

Figure 8 – Dow has lost -80% during September since 1897
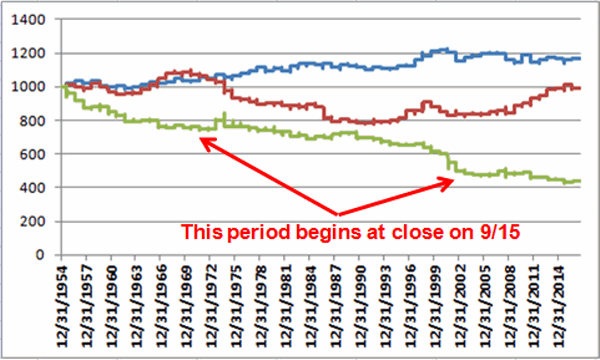
Figure 9 displays the fact that since 1955 most of the “September Nasty” has occurred in that last 10 trading days of the month (after the close on 9/15 this year)
Figure 9 – Dow in September; 1st 3 days (blue); Last 10 days (green); in between (red); 1955-2016
Investor Complacency
Despite the fact that:
*We have experienced one of the longest bull markets in history
*Stock prices are extremely overvalued on an objective historical basis
*A number of warning signs are flashing
The investment world seems relatively untroubled (in the interest of full disclosure I have done only limited selling so far myself – more on this in a moment).
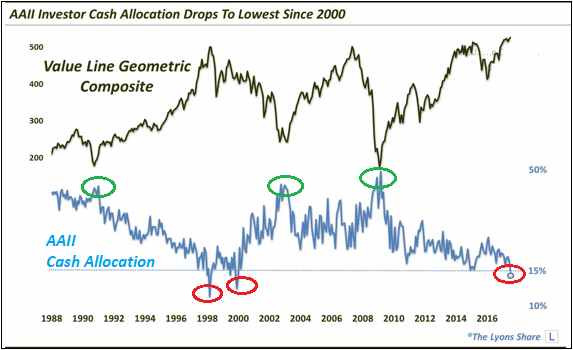
Figure 10 displays the AAII investor cash allocation reading from earlier this year. Low cash levels tend to signal complacency (and impending market trouble) while high cash levels tend to occur near market bottoms.
Figure 10 – AAII Investor Cash % is low (Courtesy: American Association of Individual Investors)
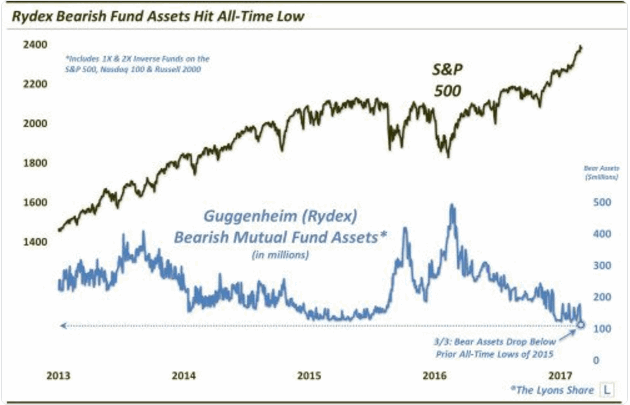
Figure 11 displays the amount of assets in the Rydex suite of “bearish” funds from earlier this year. As you can see, investors were not too concerned about the prospects for a bear market – a potential contrarian signal.
Figure 11 – Rydex Bearish Funds Assets low (Courtesy: The Lyons Share)
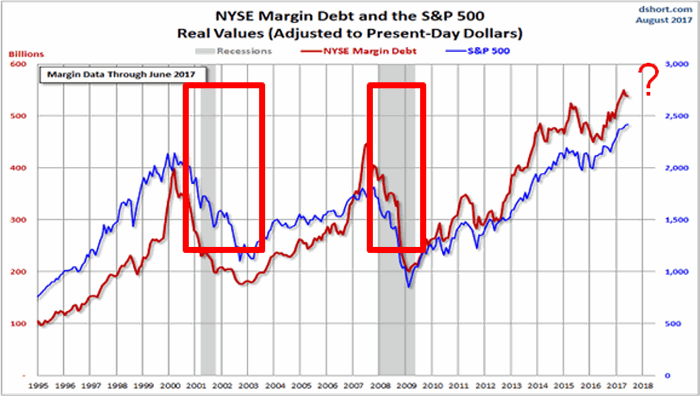
Figure 12 shows the level of margin debt versus stock prices. Historically when margin debt peaks and begins to decline the stock market suffers significantly. There is no way to predict when margin debt will top out and roll over but it did recently reach a new all-time high. Could it go higher? Absolutely. But if it rolls over – then look out below.
Figure 12 – If Margin Debt peaks trouble may follow (Courtesy: dshort.com)
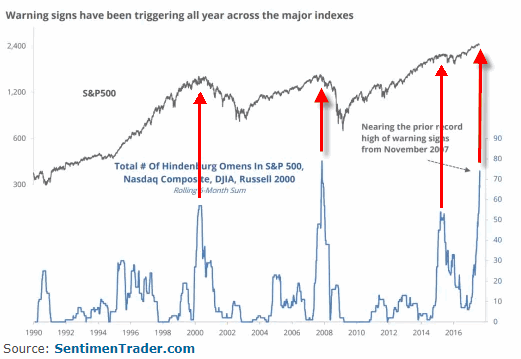
Figure 13 displays the stock market versus the number of “Hindenburg Omens” (a measure of “churning” in the stock market) that have occurred in the most recent 6-month period. Another warning sign is flashing.
Figure 13 – Hindenburg Omen flashing a warning (Courtesy: SentimentTrader.com)
Summary
Does any of the above guarantee that a significant stock market decline is imminent? The correct answer is “No.” The major market indexes all remain above their long-term moving averages. This can be considered the very definition of a bull market.
I personally have seen lots of warning signs flash along the way over the years. And I have found that it is important to pay attention to these and to “prepare for the worst” – i.e., to plan an exit/hedging strategy “just in case.” But trying to pick the exact top is an excellent way to end up looking stupid. Trust me on this one.
So here is my summary:
*I do not possess the ability to “call the top” nor to “predict what will happen next” in the stock market
*I do possess a reasonably good ability to identify the trend “right now”
*I also possess the ability to recognize gathering storms clouds (and, yes, they are forming) and the ability to formulate an “emergency plan” as well as the wherewithal to follow the plan “should this be an actual (market) emergency.”
The current level of market valuation – and the history of the stock market following previous similar such readings – suggests that the next bear market will surprise many investors by its severity.
The clouds are gathering. Please plan accordingly.
Jay Kaeppel Chief Market Analyst at JayOnTheMarkets.com and AIQ TradingExpert Pro client.
Disclaimer: The data presented herein were obtained from various third-party sources. While I believe the data to be reliable, no representation is made as to, and no responsibility, warranty or liability is accepted for the accuracy or completeness of such information. The information, opinions and ideas expressed herein are for informational and educational purposes only and do not constitute and should not be construed as investment advice, an advertisement or offering of investment advisory services, or an offer to sell or a solicitation to buy any security.

