October 16, 2020
Hello Everyone,
Over the last month, the stock markets continue to climb 2-5%, but they are not at the highs seen in the beginning of September when my computer models gave us a Sell signal. Two weeks ago My AIQ models went on 2 Buy signals and are currently on a Buy-Hold signal. The markets are now again fairly valued and somewhat overvalued mainly due to the 30 largest technology stocks that have gone up 100-500% this year. These stocks are skewing the market averages to the upside and making you believe the markets are doing better than they actually are as a whole. The bond markets are up slightly over the last month.
Many people have asked me what a Biden election would do for the the stock market. THE MARKET knows what to expect from President Donald Trump: business-friendly policies, less regulation, tariffs on imports – generally, the forces that have helped define the Trump stock market. But a few weeks out from the election, Democratic presidential nominee Joe Biden is up in the polls. So, what will happen to the stock market if Biden wins the general election this year?
First, it’s not about whether Biden wins or Trump wins. It’s also about who takes the Congress; if the Senate or House or both go Republican, then that could frustrate Biden’s agenda quite a bit. And Trump, if the Biden wins. Trumps policies are lower taxes for corporations and high net individuals and Bidens are to repeal those tax benefits. This could lead to lower corporate profits and lower earnings and lower stock prices. A Biden win could have positive benefits for Solar, wind and infrastructure companies. Overall, The increased tax rates will result in lower profits and likely lower share prices. This effect may be more than offset by a larger fiscal stimulus package passed by Congress and better trade relations with countries in Europe as well as with China. We will see what happens. If you are concerned about the direction of the markets after the election please call me over the next week to discuss your portfolio and how it may affect you. Remember, Biden is ahead on the polls and the market continues to rise. Why? Because earnings are continuing to rise and next year the economy should perfrom much better than it is doing currently. We are also going into seasonal strength from November to January. But I do expect potential major volatility over the next few months.
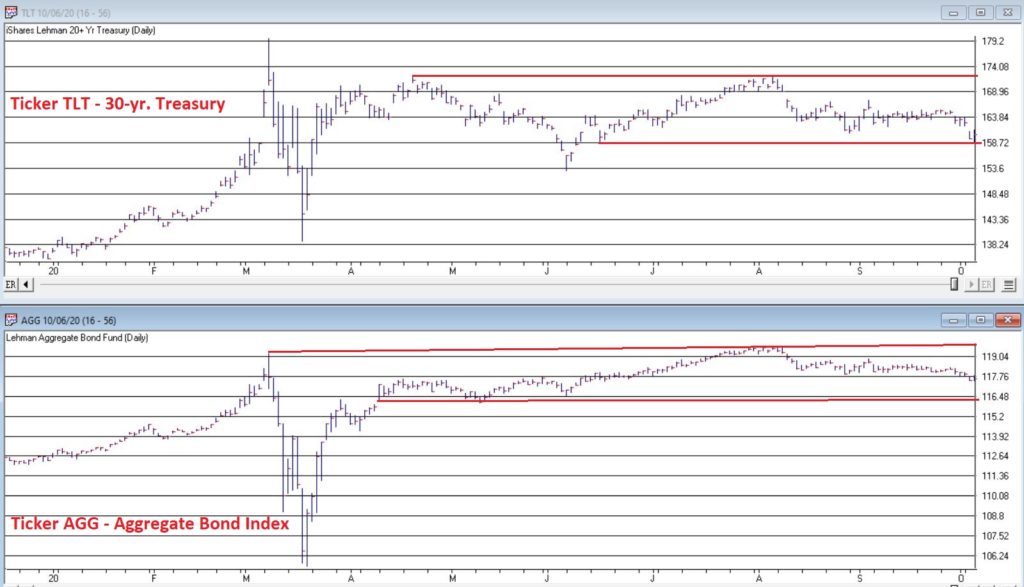
Some of the INDEXES of the markets both equities and interest rates are below. The source is Morningstar.com up until October 16, 2020. These are passive indexes. Most of you are in mutual funds and this is not a representation of your investments. Yours can be higher or lower depending on your risk tolerance and financial goal objectives.
Dow Jones +2.0%
S&P 500 +9.0%
EQUAL WEIGHTED S&P 500 -3.0%
NASDAQ Aggressive growth +28%
Large Cap Value -7.0%
I Shares Russell 2000 ETF (IWM) Small cap -1.0%
Midcap stock funds -9 to -2%
International Index (MSCI – EAFE ex USA -5%
Financial stocks -17%
Energy stocks -34%
Healthcare Stocks +7% Moderate Mutual Fund Investment Grade Bonds (AAA) Long duration +3%
High Yield Merrill Lynch High Yield Index +4% Floating Rate Bond Funds -1.6%
Short Term Bond +1.%
Fixed Bond Yields (10 year) .6% Yield
As you can see above, the only stock sectors that are benefitting are the companies benefitting by people being at home, from Zoom, to Amazon, to Facebook, gaming and more. Retail, manufacturing, airlines, value stocks, dividend stacks and many more are all down for the year.
Classicalprinicples.com and Robert Genetskis Excerpts:
Stocks were higher this past week with the Nasdaq and QQQs up 3%. Other major indexes were up 1⁄4% to 3⁄4%. There was little in the way of economic news to move markets. Earnings reports are just getting under way. My estimate is for S&P500 operating earnings of $30, up 23% from the second quarter but down 17% from a year ago. On balance, third quarter earnings reports should be a positive for stocks. Moreover, with the economy continuing to show signs of a strong recovery, investors should continue to anticipate a further recovery in earnings. In spite of the polls showing voters are likely to place Biden and Harris in charge of the nation’s policies, I continue to expect another four years of classical economic principles. In a democracy, the people get to choose which set of policies they’ll live under. I’m convinced voters will opt to continue the current set of policies.
A Look Back
Today’s report shows retail sales soared 2% in September. This brought quarterly sales 131⁄2% higher than the second quarter and up more than 5% from a year ago. The economy is close to having made a full recovery from its government- imposed shutdown. There is no need for another massive “stimulus” program, which would do more harm than good.
Weekly employment numbers continue to provide mixed signals. While weekly initial unemployment claims moved higher, insured unemployment payments and the insured unemployment ratescontinue to decline. Weekly initial unemployment claims increased close to 900,000 in the week of October 10th, up slightly from September’s average of 866,000. In contrast, the number of insured unemployment data show 10 million people received payments in the first week in October. This was down 21⁄2 million than at the beginning of September.
Despite concerns over a weak recovery, the S&P500 reached my estimate of fair value. In contrast, the Nasdaq has far exceeded all prior measures of reasonable valuation. How can stocks rise with the economy so weak? There are two reasons. First, the economy is not weak. It continues to recover rapidly. Second, monetary policy is more expansive than at any time in history.
Although stocks are either fully-valued or over-valued, they can still go higher. At this point, I’m comfortable continuing to ride the wave higher while holding 10% cash for use when the market corrects. Stay cautiously bullish.
Friday’s employment report shows a gain of 1.5 million private-sector workers in early July. The number of unemployed remains high at 16 million. The good news is that weekly unemployment insurance claims continued to improve through the end of July.
The ISM surveys of manufacturers and service companies also show employment contracting. However, these surveys show a strong surge in new orders, which will lead to an increase in jobs in August.
There are reasons why unemployment remains high. Given the uncertainty over the outlook, it’s natural to await new orders before hiring. Also, employers need to trim unessential costs to pay for the increased costs associated with the virus.
Finally, government payments not to work have appealed to many.
Source: Classical Principles.com
S&P 500 Chart Source: AIQsystems.com
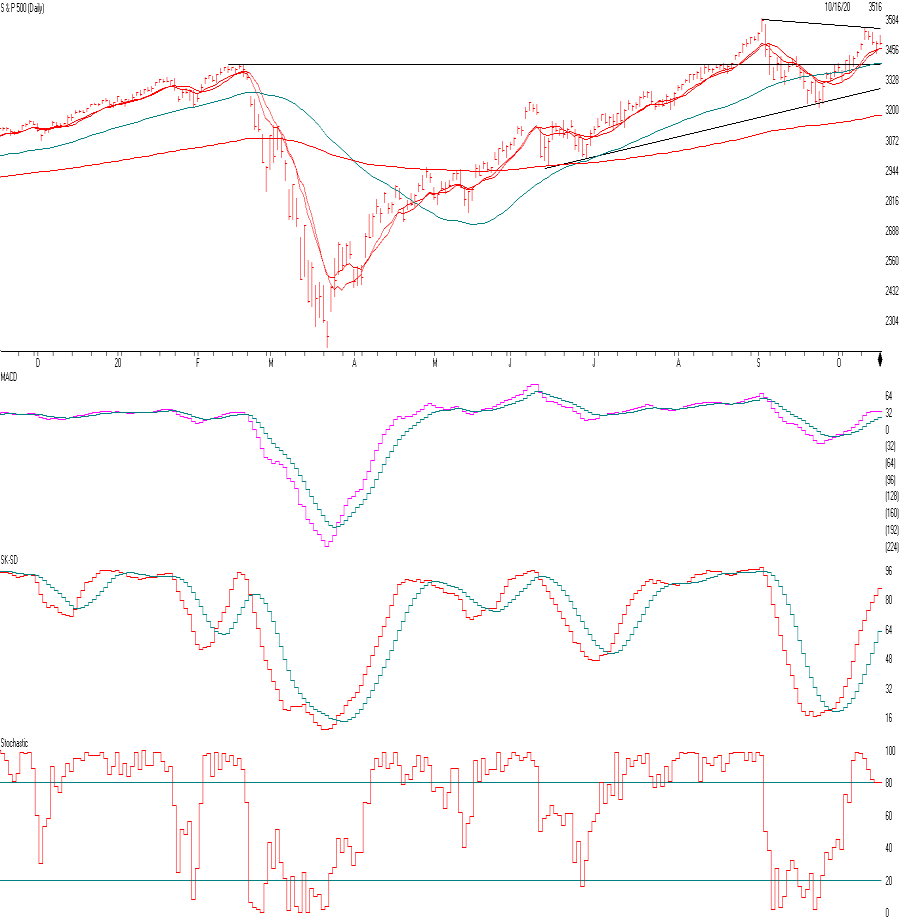
The S&P 500 is above. As you can see the S&P 500 is about 2.5% above the old high hit in February 2020. The major reason is because the tech stocks like Apple, Tesla, Microsoft and the tech stocks continue to hit new highs while the value stocks and the dividend stocks continue to falter.
Remember, most stocks are down for the year. There is Buying Support at the OLD High of 3393 about 3% lower than where we are now and support at the Trend line of 3300. On the upside 3546 would be considered a breakout and positive. So, if there is a breakdown of the stock market over the next few weeks, 3393 will be a test. If my computer models go to a SELL signal and the S&P closes below 3393 I would raise cash and if the S&P 500 closes below the the Trendline currently 3300, I would raise more cash even though I think the economy will do better next year.
The first indicator under the price chart is the MACD or Moving Average Converge Divergence. It’s a measure of momentum When the Pink line crosses the blue line on the upside, then momentum and the markets look good and when they break on the downside we have to be more cautious. Currently things are ok.
The third graph is the level of markets being overbought and oversold. Currently the market is getting near a point where it is getting a little overbought. A few more positive days in the market and we will be very overbought.
The last graph is Stochastics. If the line rises above the 80 line as it currently is the market is getting somewhat overbought but it can stay like that for a while.
So we are getting over bought somewhat, the market can go higher from here but if it closes below the two support levels above I would get more Cautious.
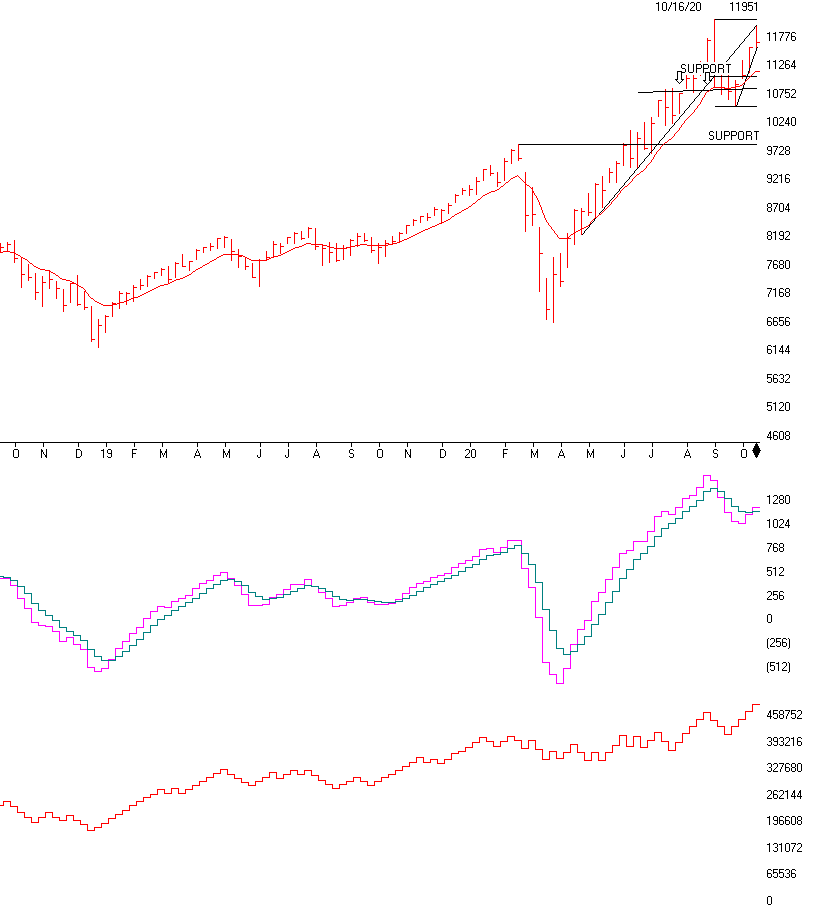
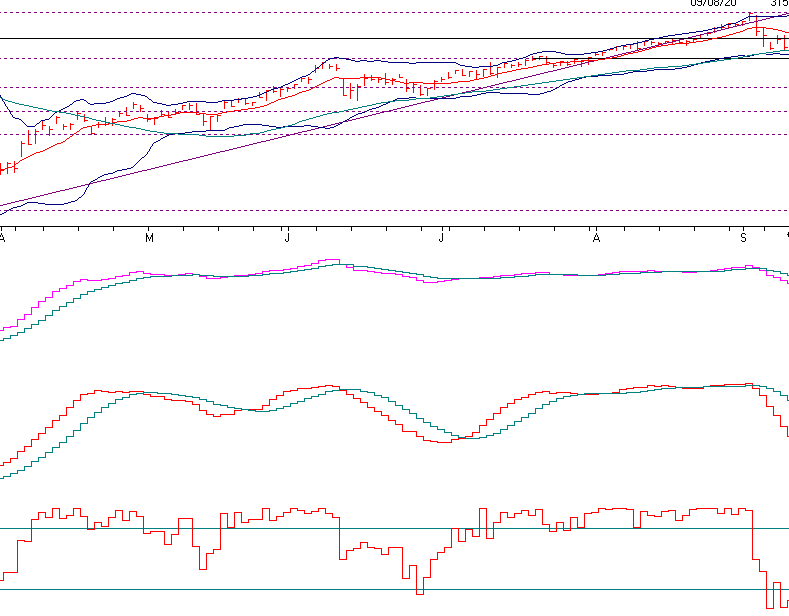
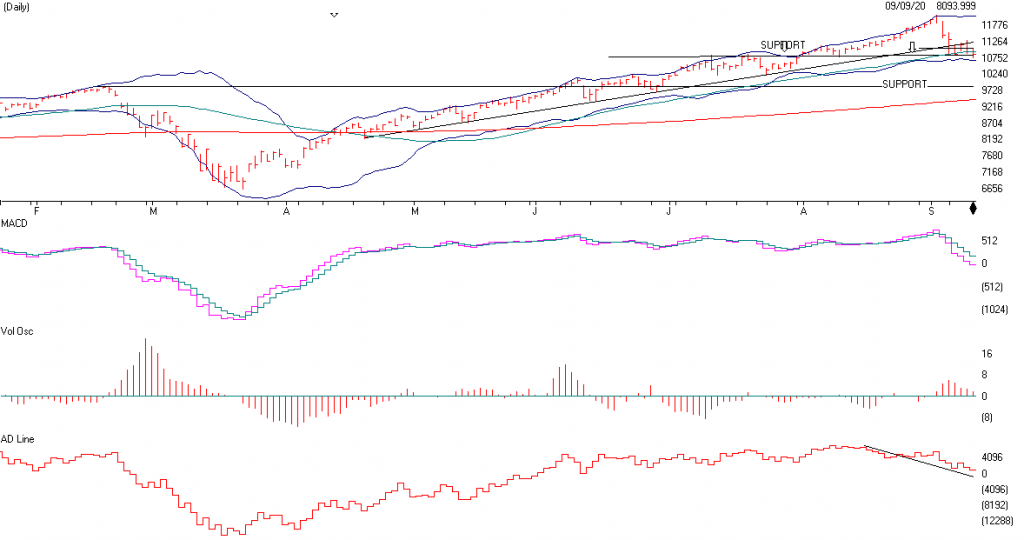
The NASDAQ (WEEKLY CHART) is above. It represents the best in the COVID sector, Apple, ZOOM, Amzon, Activison, Microsoft, Shopify, Google, Facebook and more. These stocks are benefitting substantially by people staying at home. This sector will cool down when the vaccine becomes available, safe and effective. Up until that time the NASDAQ could do relatively better than the value sector or the manufacturing, financials, retail, airlines etc. There is a caveat that could happen and that is the technical break of the support levels. To the left is the TRENDLINE, notice it is again going straight up. It is approaching the old high of 12032. It’s cuurently at 11,671 about 2.5% below its old high. We will watch it daily, but if the NASDAQ closes below 11.593, currently, then it will have broken and close below a weekly and daily Trendline, at this point I would start to raise a little cash, because the NASDAQ is very overbought and could easily fall 5 – 10 % over the next month or two. We need to do our technical analysis daily. Currently, things look good, but we need to keep our eye on all situations going into the election. One year from now and longer term I think the global economy will do much better than it is now. But short term I am still concerned about the election and the future technical situation.
MACD or Moving Average Convergence Divergance or Momentum broke out to the upside and still looks ok. But if it breaks on the downside I will be more concerned. Currently, my computer models are not on a Sell, but it needs to be watched closely, especially now.
On Balance Voume is confirming the upside of the NASDAQ, this is a positive indicator that the NASDAQ should conitune on the upside, but things change quickly.
Chart Source:AIQsystems.com
- Support levels on the S&P 500 area are 3458, 3392, 3306. 3544 is resistance.
- NASDAQ Support, 11593, 11292, 11062, 10793, 10524 and 9,841
- These may be safer areas to get into the equity markets on support levels slowly on the accumulation areas.
THE BOTTOM LINE:
The market has rebounded nicely over the last month mainly because of earnings of companies beating expectations. The NASDAQ has done the best and should continue to do well IF the market continues higher. Once the vaccine become closer to a reality the value stocks should start to rise. But up until that time the large, mid and small growth stocks could continue to dominate. You may want to call me to review everything including your 401(k) to determine the best allocation going forward. There is a major trend-line right below the markets, see above. If those are broken on a Close I will get Cautious to Very Cautious. It is important for the trendlines and the 50 day moving average to hold or it could start a correction. I like the USA market better than the international market.
Best to all of you,
Joe Bartosiewicz, CFP®
Investment Advisor Representative
92 High Street
Thomaston, CT 06787
860-940-7020
Technical Analysis is based on a study of historical price movements and past trend patterns. There is no assurance that these market changes or trends can or will be duplicated shortly. It logically follows that historical precedent does not guarantee future results. Conclusions expressed in the Technical Analysis section are personal opinions: and may not be construed as recommendations to buy or sell anything.
Disclaimer: The views expressed are not necessarily the view of Sage Point Financial, Inc. and should not be interpreted directly or indirectly as an offer to buy or sell any securities mentioned herein. Securities and Advisory services offered through Sage Point Financial Inc., Member FINRA/SIPC, an SEC-registered investment advisor.
Past performance cannot guarantee future results. Investing involves risk, including the potential loss of principal. No investment strategy can guarantee a profit or protect against loss in periods of declining values. Please note that individual situations can vary. Therefore, the information presented in this letter should only be relied upon when coordinated with individual professional advice. *There is no guarantee that a diversified portfolio will outperform a non-diversified portfolio in any given market environment. No investment strategy, such as asset allocation, can guarantee a profit or protect against loss in periods of declining values.
It is our goal to help investors by identifying changing market conditions. However, investors should be aware that no investment advisor can accurately predict all of the changes that may occur in the market.
The price of commodities is subject to substantial price fluctuations of short periods and may be affected by unpredictable international monetary and political policies. The market for commodities is widely unregulated, and concentrated investing may lead to Sector investing may involve a greater degree of risk than investments with broader diversification.
Indexes cannot be invested indirectly, are unmanaged, and do not incur management fees, costs, and expenses.
Dow Jones Industrial Average: A weighted price average of 30 significant stocks traded on the New York Stock Exchange and the NASDAQ.
S&P 500: The S&P 500 is an unmanaged indexed comprised of 500 widely held securities considered to be representative of the stock market in general.
NASDAQ: the NASDAQ Composite Index is an unmanaged, market-weighted index of all over the counter common stocks traded on the National Association of Securities Dealers Automated Quotation System
(IWM) I Shares Russell 2000 ETF: Which tracks the Russell 2000 index: which measures the performance of the small capitalization sector of the U.S. equity market.
A Moderate Mutual Fund risk mutual has approximately 50-70% of its portfolio in different equities, from growth, income stocks, international and emerging markets stocks to 30-50% of its portfolio in different categories of bonds and cash. It seeks capital appreciation with a low to moderate level of current income.
The Merrill Lynch High Yield Master Index: A broad-based measure of the performance of non-investment grade US Bonds
MSCI EAFE: the MSCI EAFE Index (Morgan Stanley Capital International Europe, Australia, and Far East Index) is a widely recognized benchmark of non-US markets. It is an unmanaged index composed of a sample of companies’ representative of the market structure of 20 European and Pacific Basin countries and includes reinvestment of all dividends.
Investment grade bond index: The S&P 500 Investment-grade corporate bond index, a sub-index of the S&P 500 Bond Index, seeks to measure the performance of the US corporate debt issued by constituents in the S&P 500 with an investment-grade rating. The S&P 500 Bond index is designed to be a corporate-bond counterpart to the S&P 500, which is widely regarded as the best single gauge of large-cap US equities.
Floating Rate Bond Index is a rule-based, market-value weighted index engineered to measure the performance and characteristics of floating-rate coupon U.S. Treasuries, which have a maturity greater than 12 months.