The bond market was very quiet in the 3rd quarter. Figure 1 displays ticker IEF (7-10 year treasuries ETF) in the to clip and ticker AGG (Aggregate Bond Index ETF) in the bottom clip.
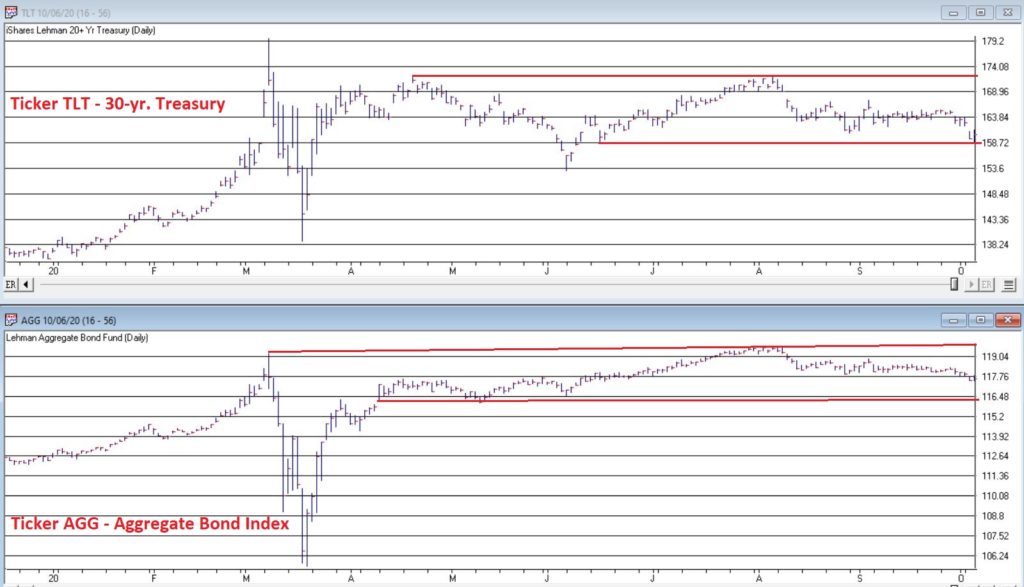
Figure 1 – Tickers IEF and AGG in narrow ranges (Courtesy AIQ TradingExpert)
Essentially the entire bond market has been flat since early June. The market seems to be assuming that “the Fed will take of everything” and keep interest rates low and stable for the foreseeable future so…..ZZZZZZZZ.
But this type of activity often breeds complacency. I am not making any predictions here but I do want to raise a question that investors might wish to ponder, i.e., “what would be more shocking that a spike in interest rates?” OK, yes, I realize it is 2020 and it is pretty much hard to be shocked by anything anymore. But still, on a relative basis how many investors are even thinking about the potential risk of higher interest rates at the moment?
Could it Happen?
The Bond Market VIX (ticker MOVE) recently fell to its lowest level ever (before spiking sharply higher on 10/5/20). As you can see in Figure 2 this type of “quietness” often precedes a significant move in the bond market. For the record, low readings in MOVE can be followed by large up moves in price as easily as large down moves in price. So, a low MOVE reading is not “bearish” per se, but rather merely suggests that we are experiencing the “calm before the storm.”
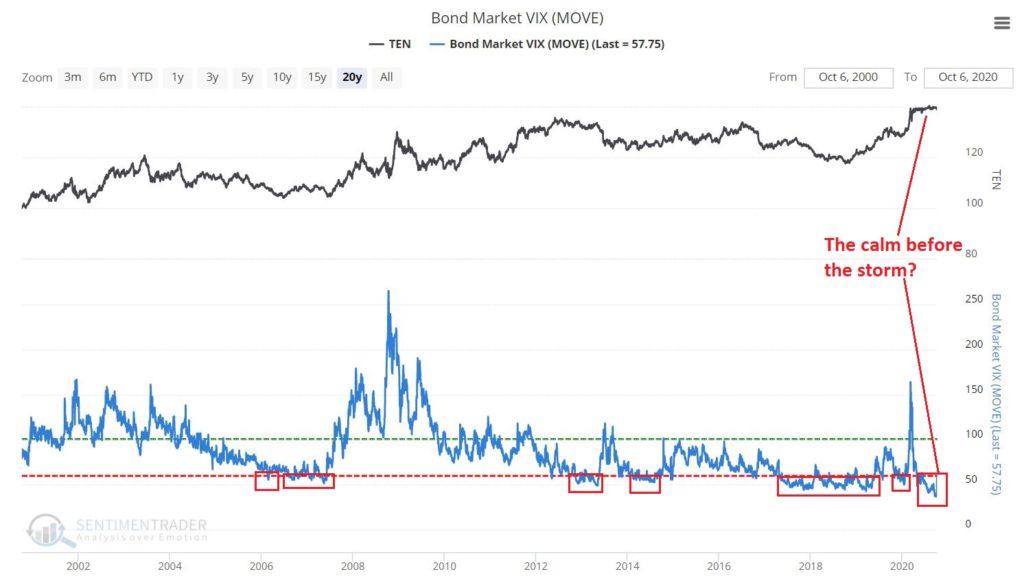
Figure 2 – Bond Market VIX hit an all-time low (Courtesy Sentimentrader.com)
So why is my “Spidey sense” tingling? Figure 3 displays the yield on 30-year treasuries (ticker TYX) on the bottom and an indicator I refer to as VFAA on the bottom (the calculation appears at the end of this piece). VFAA is a derivative on a Larry William’s indicator he calls VixFix.
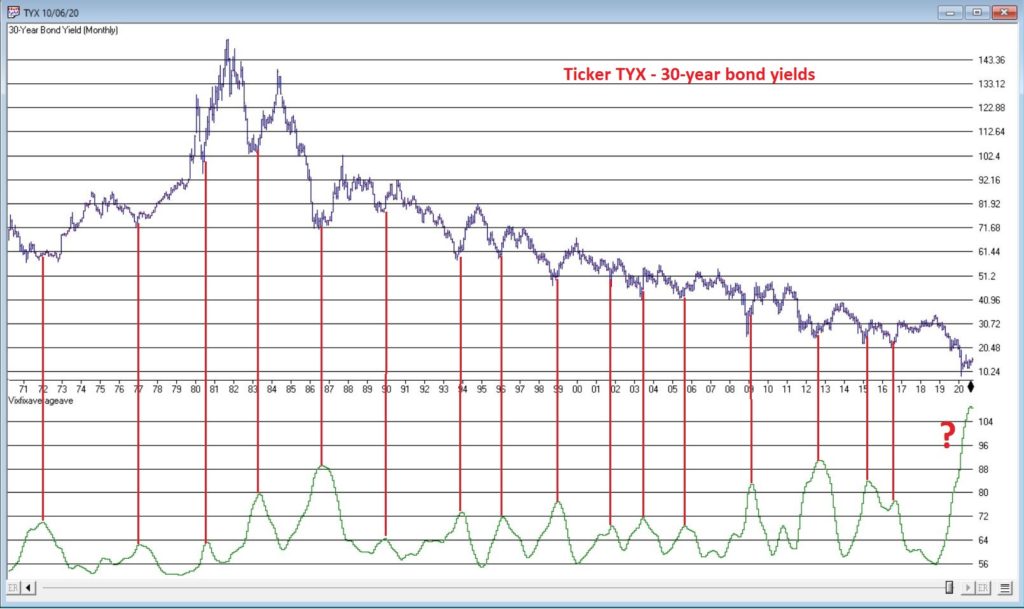
Figure 3 – 30-year treasury yields with VFAA suggesting a potential bottoming area (Courtesy AIQ TradingExpert)
As you can see in Figure 3, peaks in the VFAA indicator often occur near intermediate term lows in bond yields (reminder: bond prices move inversely to yield, so a bottom in interest rates indicates a top in bond prices). As you can also see on the far-right hand side, the stage clearly appears to be set for “the next go round.”
Why does this matter? If interest rates do rise in the months ahead bond prices – particularly long-term bond prices can get hit hard. To illustrate the potential risks, Figure 4 displays the action of treasury security ETFs of various maturity during a 5-month rise in rates back in 2016.
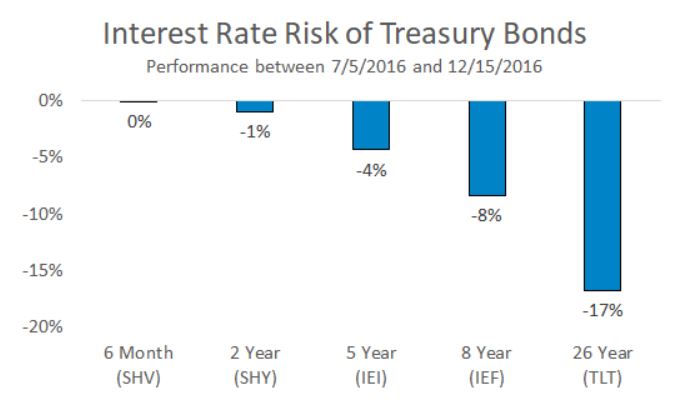
Figure 4 – Bond ETF action during rate rise in 2016
Summary
It is possible for long and short-term bonds to “de-couple”. In other words, the possibilities are:
*Short-term rates remain stable (as the Fed keeps pumping) while long-term rates rise (as inflation fears arise as a result of all the Fed pumping)
*Short-term rates remain stable while long-term rates plummet (if the economy appears to be weakening). This would result in gains for long-term bonds only
*None of the above
The bottom line: Bonds have fallen asleep – but DO NOT fall asleep on bonds.
VFAA Formula
Below is the code for VFAA
VixFix is an indicator developed many years ago by Larry Williams which essentially compares the latest low to the highest close in the latest 22 periods (then divides the difference by the highest close in the latest 22 periods). I then multiply this result by 100 and add 50 to get VixFix.
*Next is a 3-period exponential average of VixFix
*Then VFAA is arrived at by calculating a 7-period exponential average of the previous result (essentially, we are “double-smoothing” VixFix)
Are we having fun yet? See code below:
hivalclose is hival([close],22).
vixfix is (((hivalclose-[low])/hivalclose)*100)+50.
vixfixaverage is Expavg(vixfix,3).
vixfixaverageave is Expavg(vixfixaverage,7).
VFAA = vixfixaverageave
Jay Kaeppel
Disclaimer: The information, opinions and ideas expressed herein are for informational and educational purposes only and are based on research conducted and presented solely by the author. The information presented represents the views of the author only and does not constitute a complete description of any investment service. In addition, nothing presented herein should be construed as investment advice, as an advertisement or offering of investment advisory services, or as an offer to sell or a solicitation to buy any security. The data presented herein were obtained from various third-party sources. While the data is believed to be reliable, no representation is made as to, and no responsibility, warranty or liability is accepted for the accuracy or completeness of such information. International investments are subject to additional risks such as currency fluctuations, political instability and the potential for illiquid markets. Past performance is no guarantee of future results. There is risk of loss in all trading. Back tested performance does not represent actual performance and should not be interpreted as an indication of such performance. Also, back tested performance results have certain inherent limitations and differs from actual performance because it is achieved with the benefit of hindsight.