Unlock the clues that show when trends are about to continue or reverse.
Many traders chase obvious signals, only to miss the most profitable opportunities. Hidden divergences are subtle clues in price and indicators that can reveal trend continuation or early reversals before most traders even notice.
In this live session, you’ll learn how to spot these powerful signals using classic technical indicators and apply them in your trading with confidence.
What Is a Hidden Divergence?
A hidden divergence occurs when the indicator and price move in opposite ways, but unlike regular divergence, it signals a trend continuation rather than a reversal.
Types of hidden divergences:
Bullish Hidden Divergence: Price makes a higher low, but the indicator (e.g., RSI, MACD, Stochastic) makes a lower low → suggests the uptrend will continue.
Bearish Hidden Divergence: Price makes a lower high, but the indicator makes a higher high → suggests the downtrend will continue.
P.S. Divergences are only useful if you can see them. This 20-minute session will show you how.
AIQ’s Market Timing Expert Ratings compress hundreds of technical conditions into a single, actionable score. Use 95+ up or down ratings as “of-notice” events, then confirm direction with the Price Phase indicator before acting. This simple two-step process keeps you aligned with the dominant swing while filtering many head fakes.
What the Market Timing Expert Rating Really Is
Under the hood, the AIQ Expert System evaluates ~400+ indicator states through an inference engine (decision-tree style) and outputs a daily market rating—from neutral to powerful up/down signals. You’ll also see these ratings plotted directly on historical charts in TradingExpert Pro.
Why that matters: Instead of juggling dozens of internals, you get a unified, explainable read of market conditions that has been kept methodologically stable for years (no goal-post shifting or perpetual re-optimization). That stability helps make the historical behavior of the signals more comparable across cycles.
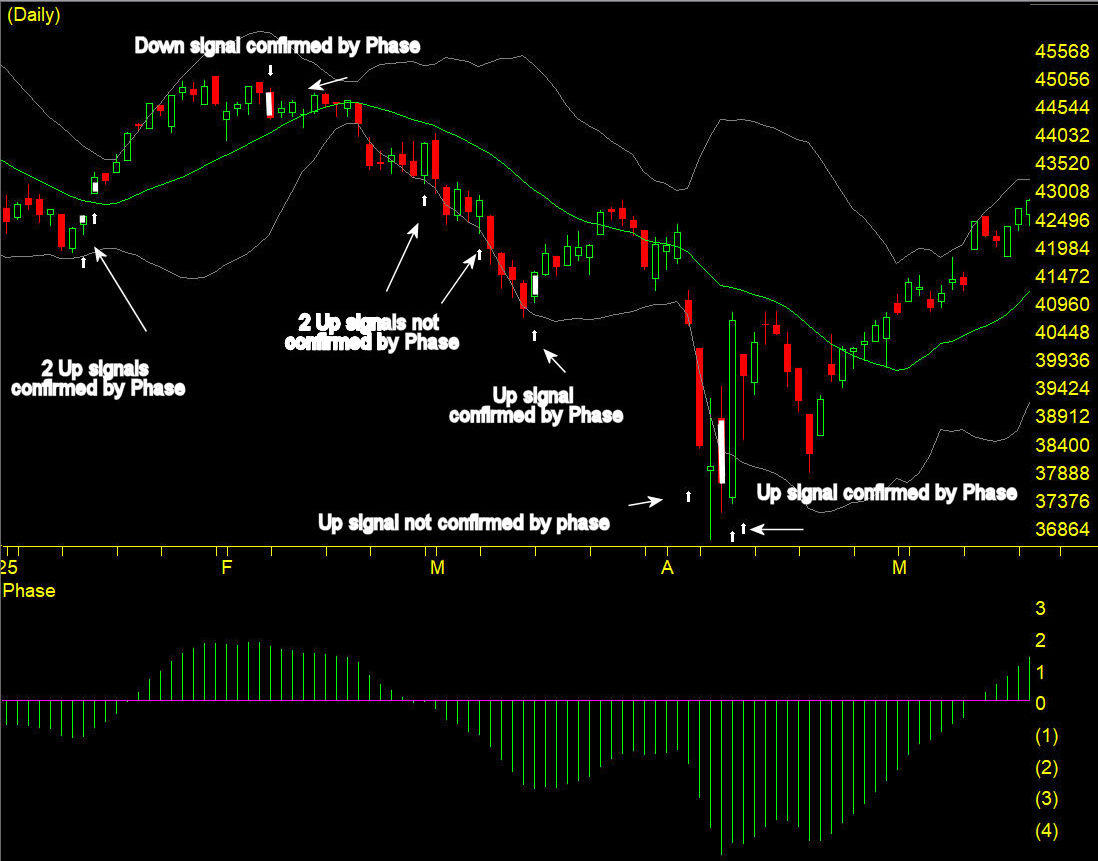
AIQ Market Timing signals with confirmation by Phase Jan – May 2025
The Confirmation Key: AIQ’s Price Phase Indicator
AIQ explicitly recommends using the Price Phase Indicator (“Phase”) as the primary filter for Expert Ratings. When Phase direction agrees with a high Expert Rating signal, the signal is considered confirmed. In other words:
Strong Up Rating (≥95) → look for Phase turning up or already rising to confirm.
Strong Down Rating (≥95) → look for Phase turning down or already falling to confirm.
This is purposeful: Expert Ratings often fire early—giving you a heads-up—while Phase helps you avoid acting too soon. Think of Ratings as the alert and Phase as the green light.
Interpreting the Score: When Does “High” Mean “Actionable”?
Per AIQ’s guidance, 95 or greater to the upside or downside is the zone “of notice.” That’s when you should lean in, check Phase, and consider entries/exits or hedges—not when readings are middling or neutral. Most days are neutral; the edge lives in waiting for 95+ and confirming with Phase.
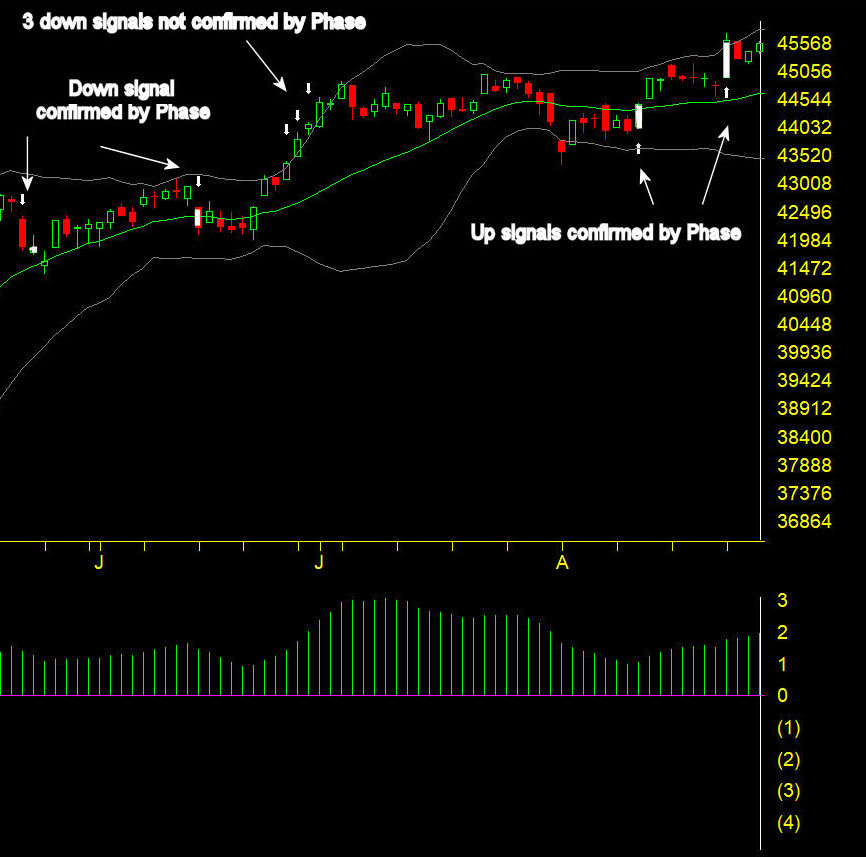
AIQ Market Timing signals with confirmation by Phase May – Aug 2025
Where to See It in TradingExpert Pro
On your AIQ Main Menu, select Market Charts, and plot Price Phase in a lower pane. This combination is designed for side-by-side evaluation.
If you prefer a visual “state” view, Heikin-Ashi-mode bars with Phase underneath are often used in AIQ’s examples to highlight trend persistence.
How to Read the 2025 Chart (Step-by-Step Playbook)
Spot the Spike Scan for 95+ up/down ratings. Put a small flag on each to review.
Check Phase Direction
If the rating is Up (≥95), is Phase rising or just turned up?
If Down (≥95), is Phase falling or just turned down? Match = Confirmation. No match? Put it on watch—often the earliest ratings need a bar or two before Phase confirms.
Plan Entries/Exits
For confirmed Up: consider scaling into risk-defined long exposure, tightening shorts.
For confirmed Down: consider trimming longs, or tactical shorts—again, with risk clearly defined.
Manage the Hold Historical AIQ studies often show swing-length holds rather than ultra-short scalps (average holds are one week to several weeks), but your trade horizon should match your strategy.
Best Practices (That Save You from Heartache)
Don’t front-run Phase on big ratings. Early feels clever until it doesn’t. Let the filter do its job.
Treat 95 as your attention alarm. Below that, conserve focus; above that, prepare plans.
Neutral = No edge. Most days are noise; your edge is in selectivity.
Common Questions
Q: Are the rules curve-fit over time? A: AIQ deliberately keeps the rating calculation stable, avoiding constant re-tuning. That consistency is part of why the historical behavior is analyzable.
Q: Is Phase the only valid confirmation? A: It’s AIQ’s primary confirmation tool for Expert Ratings and the one used in the official “confirmed” flagging. You can add your own overlays, but Phase remains the recommended filter.
Q: Do signals work on intraday charts? A: The Market Timing ratings are generated daily. You can time entries intraday after a daily confirmation, but the signal itself is evaluated on the daily close framework.
Final Word
AIQ’s Market Timing Expert Ratings give you clean, explainable signals—and the Price Phase indicator gives you the discipline to act only when odds tilt in your favor. Use the 95+ threshold to focus, Phase to confirm, and your risk plan to stay in the game when it counts.
In a recent Zoom meeting, Steve Hill, CEO of AIQ Systems, shared Bollinger Bands Setups, Variations & Trade Timing. In this article, we’ll expand on using %B and creating custom indicators to help identify trade setups using Bollinger Bands and %B.
When John Bollinger introduced Bollinger Bands in the 1980s, traders gained a powerful visual tool for understanding market volatility and potential turning points. But tucked away inside the Bollinger Band toolkit is a lesser-known gem: %B.
If Bollinger Bands are the map, %B is the GPS — it tells you exactly where price is, relative to the bands, at any given time. This extra precision can help you spot breakouts, reversals, and trend confirmations faster.
What is %B?
%B measures the position of the last closing price within the Bollinger Band range.
%B = 1.0 → Price is exactly at the upper Bollinger Band.
%B = 0.0 → Price is exactly at the lower Bollinger Band.
%B > 1.0 → Price is above the upper band (potential breakout or overbought).
%B < 0.0 → Price is below the lower band (potential breakdown or oversold).
Why Use %B Instead of Just the Bands?
While the bands themselves are great for visual trading, %B turns them into a precise numeric oscillator that’s perfect for:
Coding trading systems (like in AIQ’s Expert Design Studio).
Screening for setups in thousands of stocks.
Backtesting with exact entry/exit rules rather than “eyeballing” the chart.
Five Ways to Use %B in Trading
1. Overbought/Oversold Mean Reversion
Buy when %B < 0.05 (price hugging lower band) and momentum turns up.
Sell when %B > 0.95 (price hugging upper band) and momentum turns down.
2. Trend Breakouts
Buy when %B crosses above 1.0 (price breaks above upper band in an uptrend).
Sell when %B crosses below 0.0 (price breaks below lower band in a downtrend).
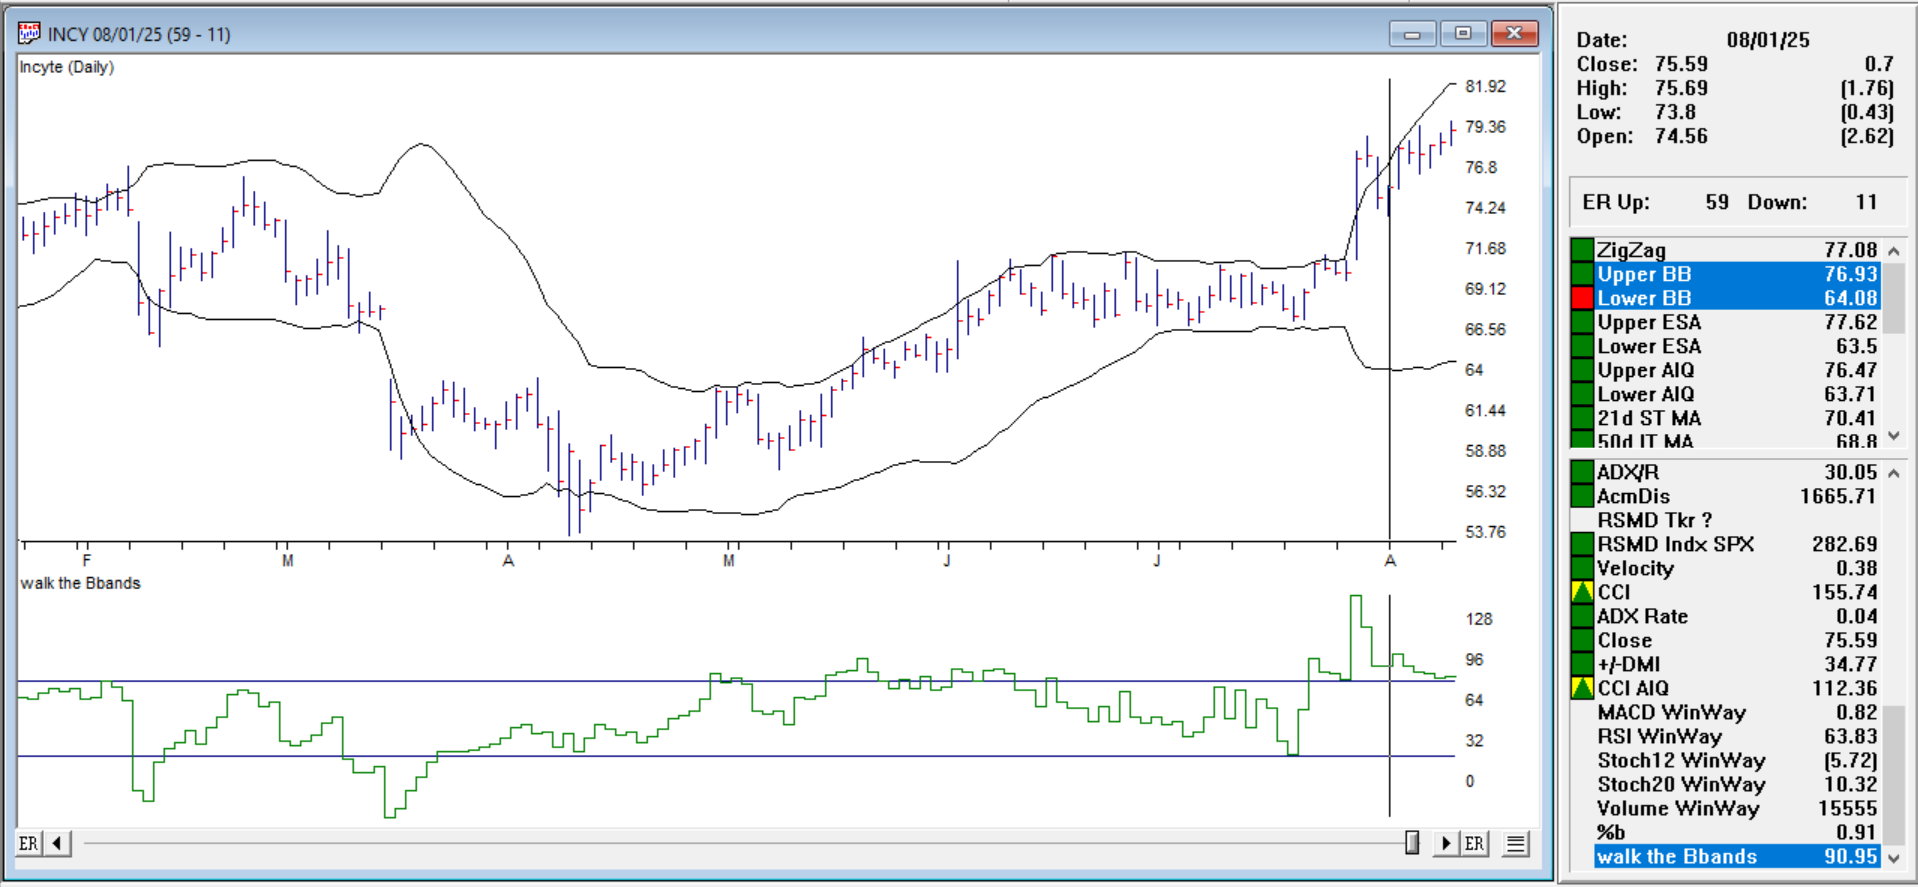
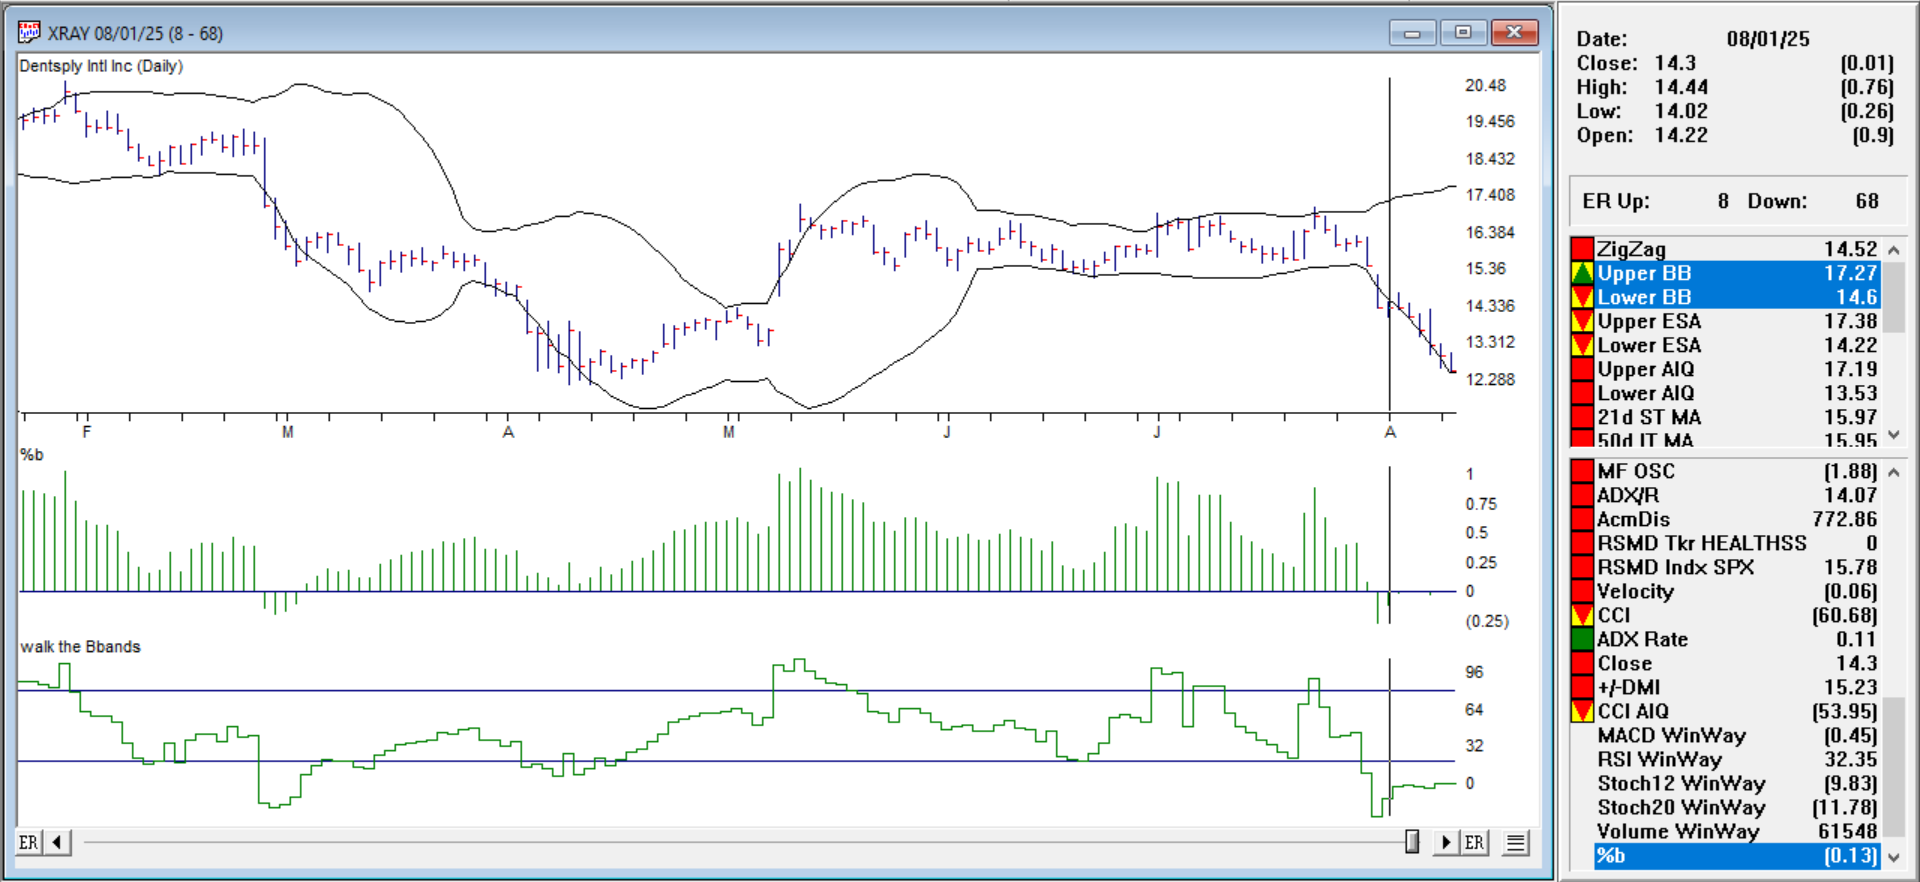
3. Band “Walks”
In strong trends, price can “walk” the band.
In an uptrend, %B will often stay above 0.8 for extended periods.
In a downtrend, %B will often stay below 0.2.
For AIQ TradingExpert Pro, we’ll create an EDS strategy that looks for all these setups and generates two indicators.
%B as a histogram in Charts, and a Walk the BBands indicator, where we’ll create upper and lower thresholds, where we can see %B stays above or below these thresholds for several days.
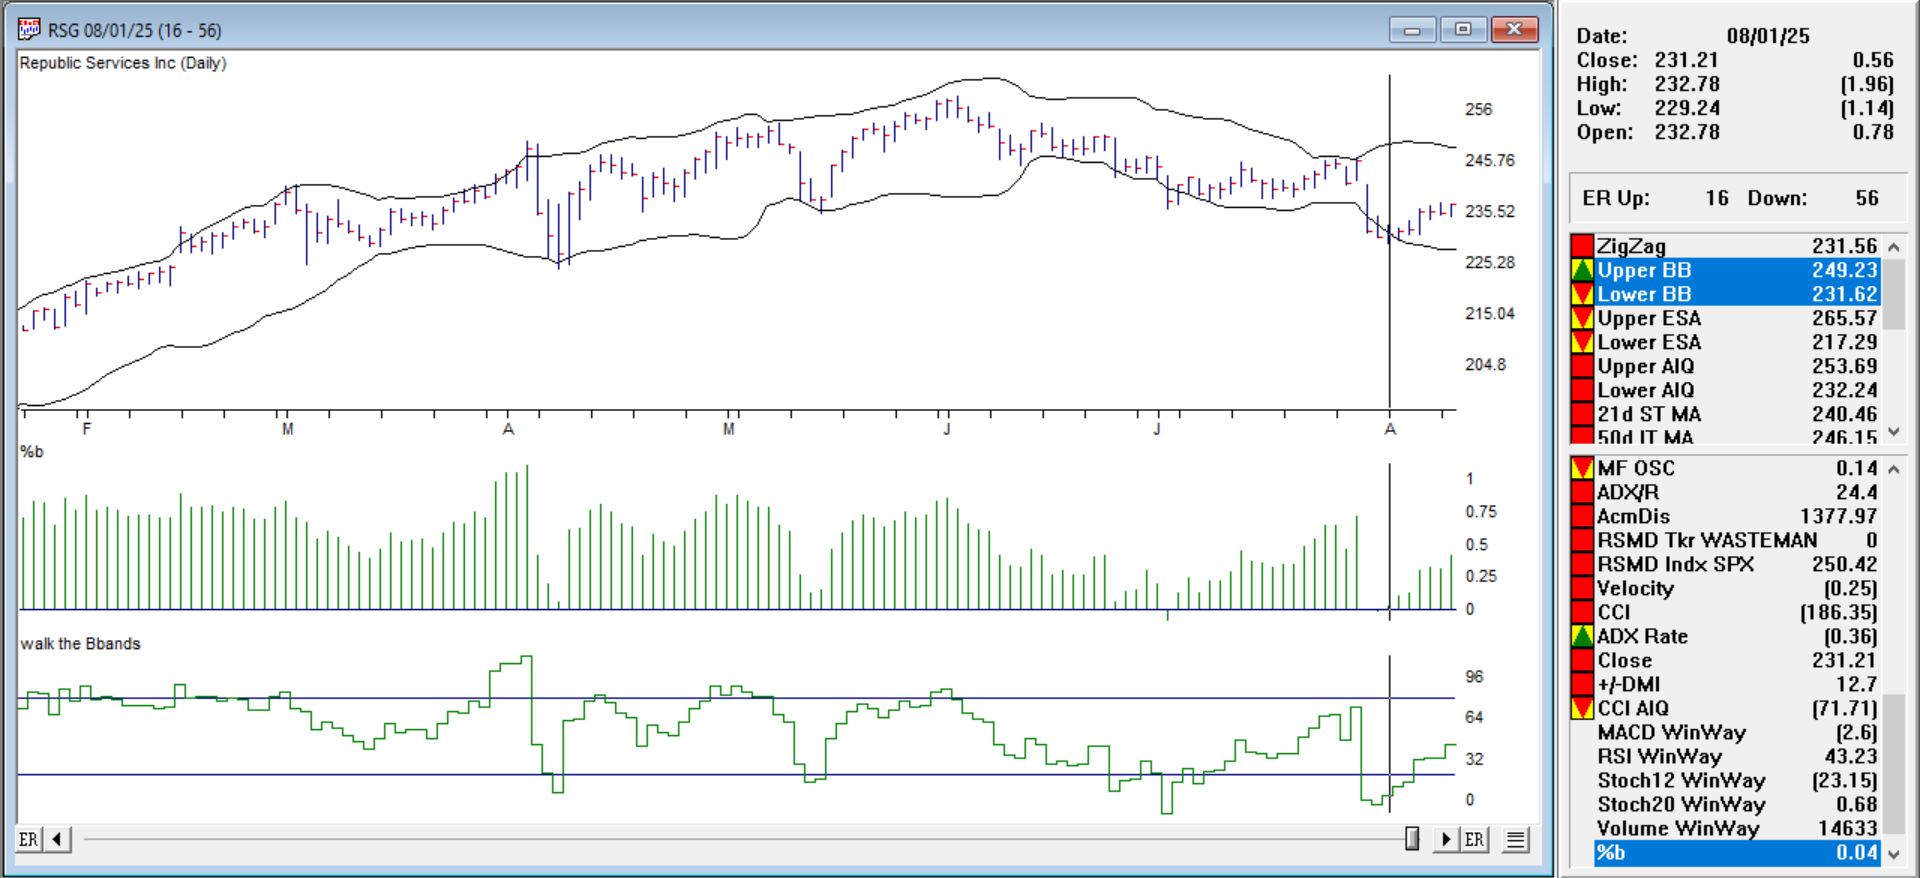
Example Setups from the EDS scan 8-1-2025
Buy when %B < 0.05 (price hugging lower band) and momentum turns up. Ticker RSG %B histogram is 0.05 8-1-25, prices moved moderately up.
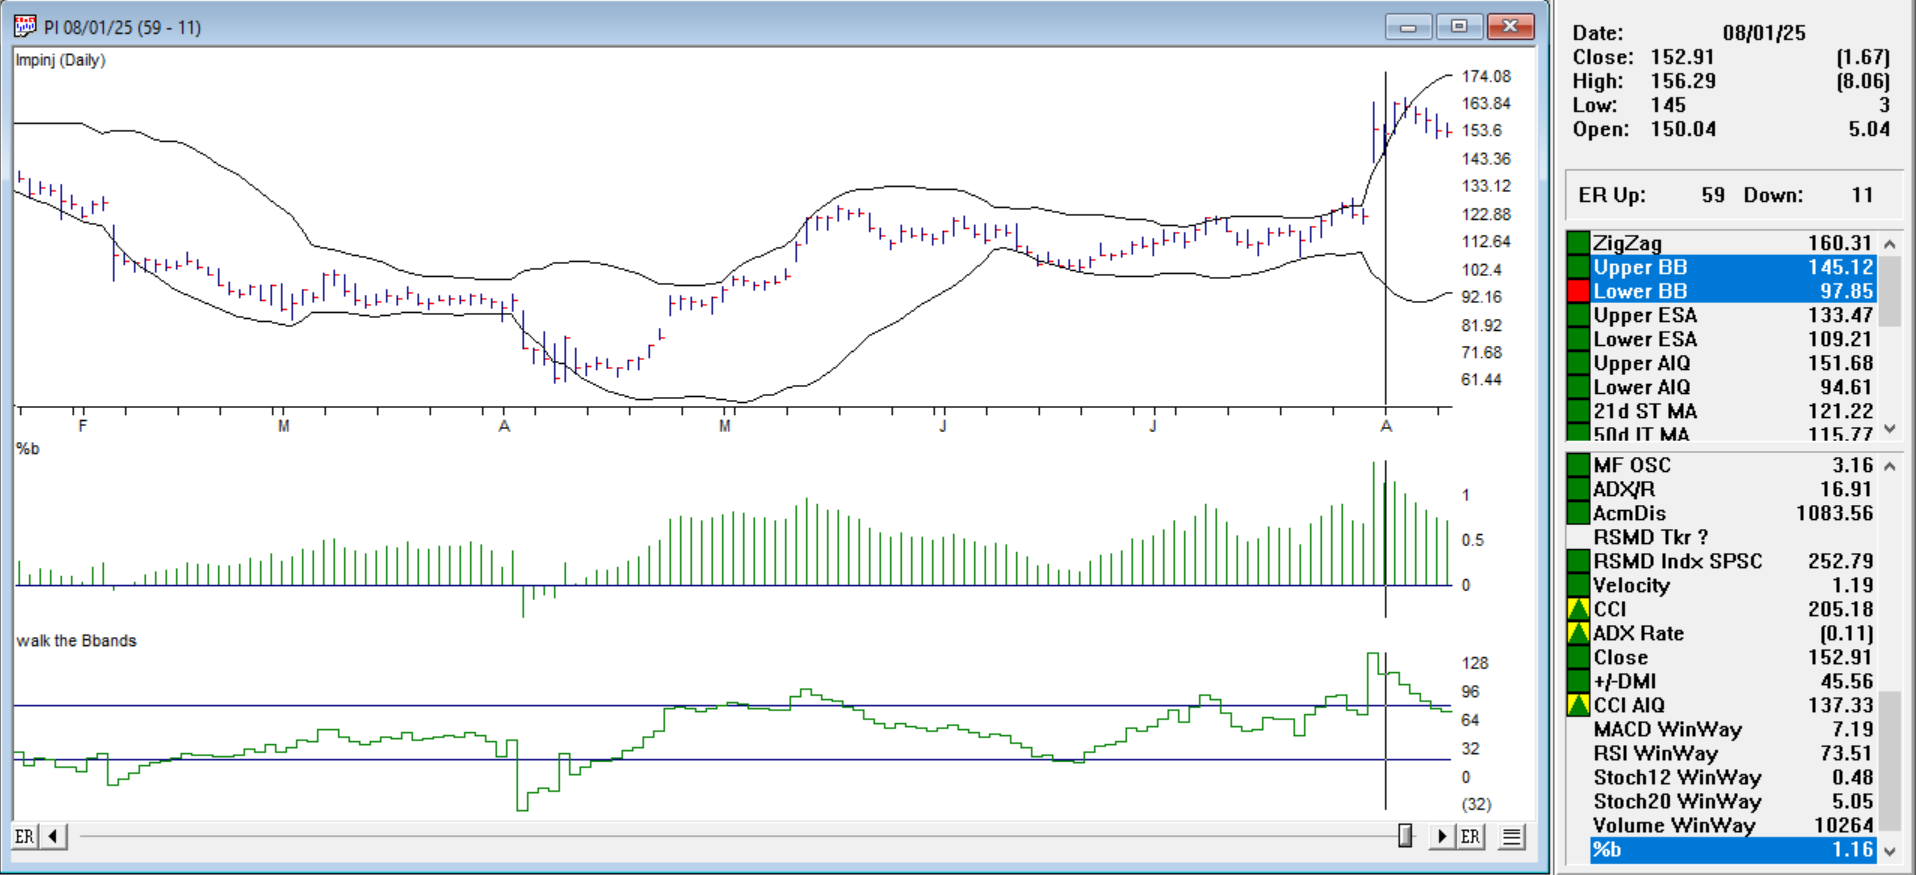
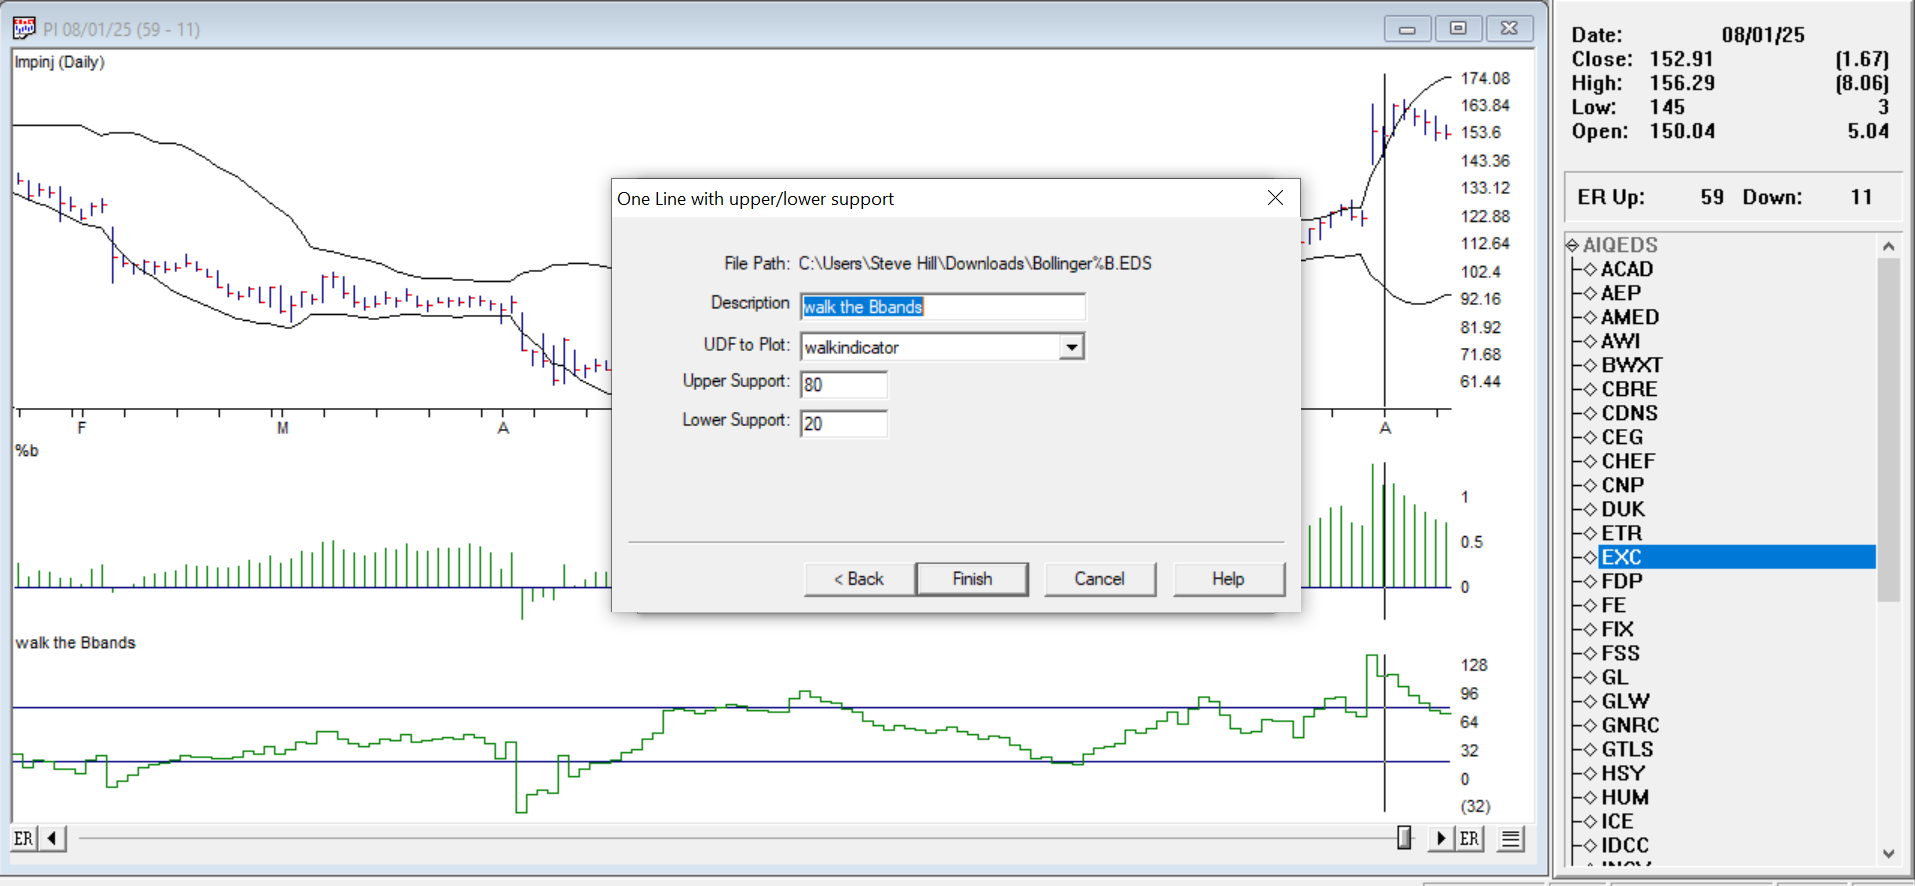
Sell when %B > 0.95 (price hugging upper band) and momentum turns down. Ticker PI %B histogram is 1.16, prices turned down.
Walk the band up. In an uptrend, %B will often stay above 0.8 for extended periods. Ticker INCY shows above our 80 line in the Walk the BBands indicator and continues to do so.
Walk the band down. In a downtrend, %B will often stay below 0.2. Ticker XRAY shows below our 20 line in the Walk the BBands indicator and continues to do so.
Click here to download this zipped EDS file. Locate the Bollinger%25B.zip file usually in your downloads folder and extract the Bollinger%25B.EDS file to your /wintes32/EDS strategies folder.
The code is below
EDS code
! — How to Use the %B Indicator for Smarter Trading
! — When John Bollinger introduced Bollinger Bands in the 1980s, traders gained ! — a powerful visual tool for understanding market volatility and potential turning points. ! — It tells you exactly where price is, relative to the bands, at any given time. ! — This extra precision can help you spot breakouts, reversals, and trend confirmations faster.
Periods is 20.
Multiplier is 2.
! Step 1: Moving Average of Close
MA20 is simpleavg([close],Periods).
! Step 2: Squared Deviations from MA
Deviation is ([close] - MA20) * ([close] - MA20).
! Step 3: Average of Squared Deviations
Var20 is simpleavg(Deviation,Periods).
! Step 4: Square Root to get Standard Deviation
SD20 is sqrt(Var20).
! Step 5: Upper and Lower Bands
UpperBand is MA20 + Multiplier * SD20.
LowerBand is MA20 - Multiplier * SD20.
! Step 6: %B Calculation
PercentB is ([close] - LowerBand) / (UpperBand - LowerBand).
! — Buy when %B < 0.05 (price hugging lower band) and momentum turns up.
BuyReversal if PercentB < 0.05 and [close] > val([close],1).
! — Sell when %B > 0.95 (price hugging upper band) and momentum turns down.
SellReversal if PercentB > 0.95 and [close] < val([close],1).
! — Buy when %B crosses above 1.05 (price breaks above upper band in an uptrend).
BuyBreakout if PercentB > 1.05.
! — Sell when %B crosses below -0.05 (price breaks below lower band in a downtrend).
SellBreakdown if PercentB < -0.05.
! — create an indicator for walking the bands use a one line indicator with upper at 80 lower at 20 by %B x100
walkindicator is PercentB*100.
! — Band “Walks” in strong trends up, price can walk, the band %B will often stay above 0.8 for extended periods.
walkuptoday if walkindicator>80.
walkup1ydy if valresult(walkindicator,1)>80.
walkup2back if valresult(walkindicator,2)>80.
wlkupfor3days if walkuptoday and walkup1ydy and walkup2back.
! — Band “Walks” in strong trends down, price can walk, the band %B will often stay below 0.2 for extended periods.
walkdowntoday if walkindicator<20.
walkdown1ydy if valresult(walkindicator,1)<20.
walkdown2back if valresult(walkindicator,2)<200.
wlkdownfor3days if walkdowntoday and walkdown1ydy and walkdown2back
Adding the %B and Walking the BBands Indicator
Open Charts.
Go to Chart → Settings → Indicator Library → EDS Indicators. Click Add.
Select the Bollinger%25B.EDS file from your /wintes32/EDS strategies folder and click Open.
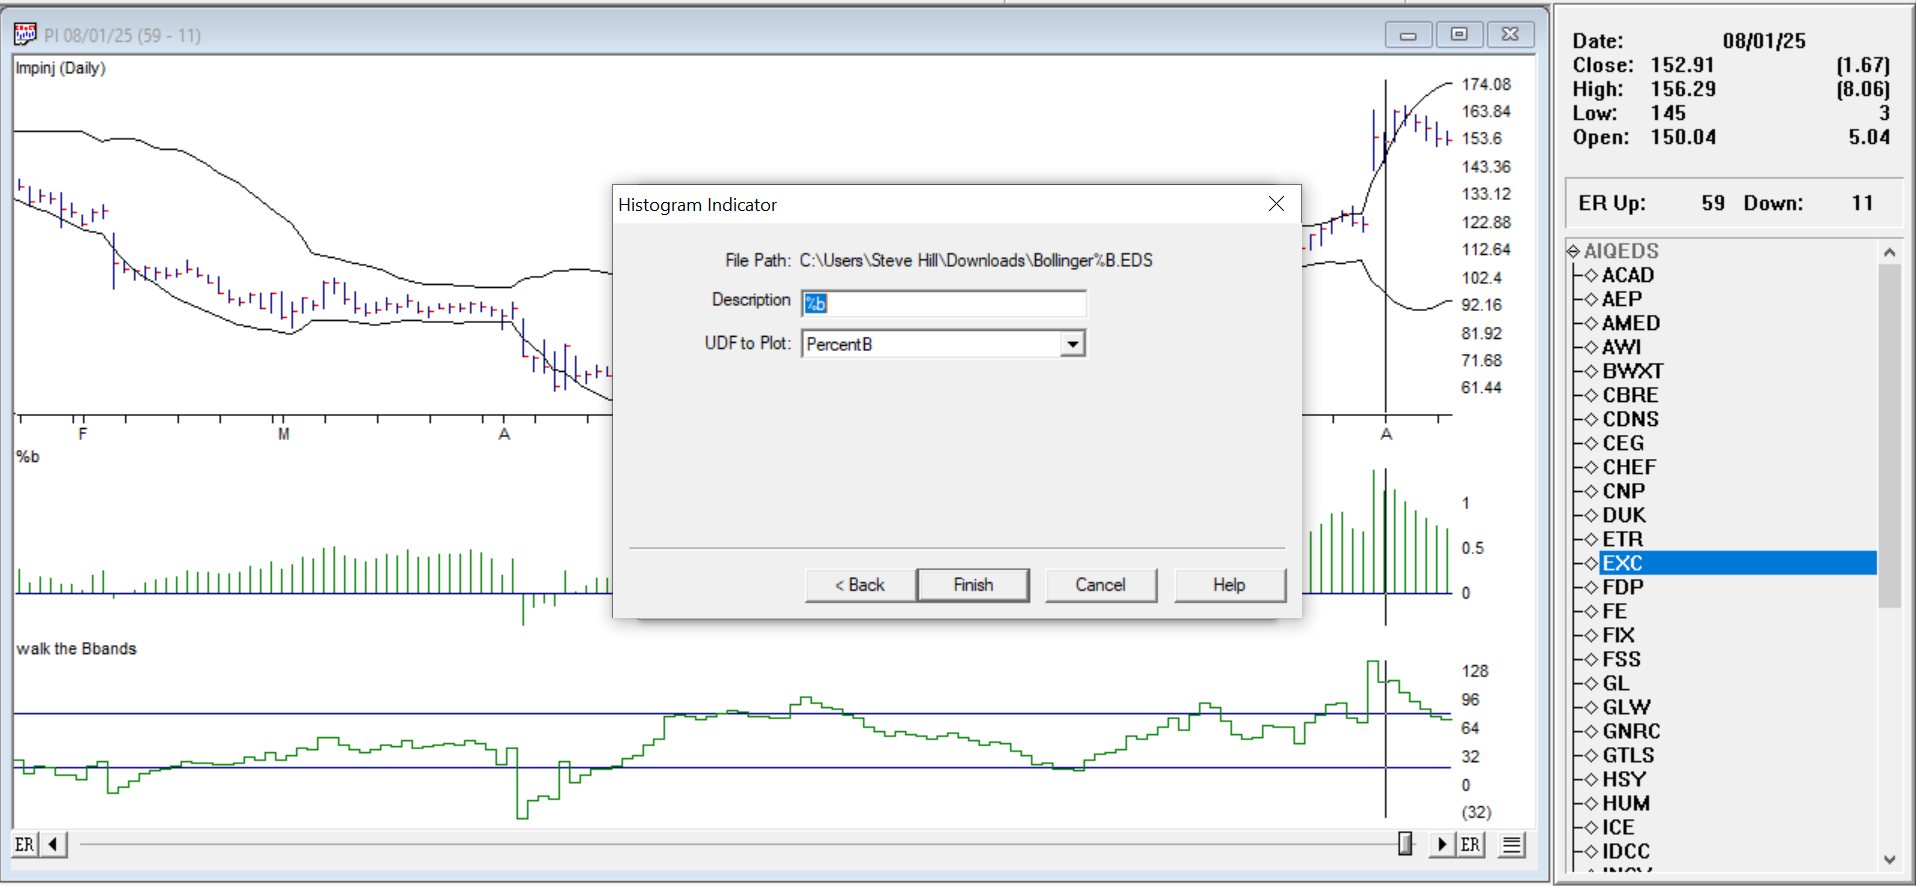
Choose a Plot Type Histogram for %B
Give it a Description/Name, then choose the UDF to Plot (PercentB).
Click Finish, then Done. Your new indicator now appears in the Indicator Library and can be added to charts like any other study.
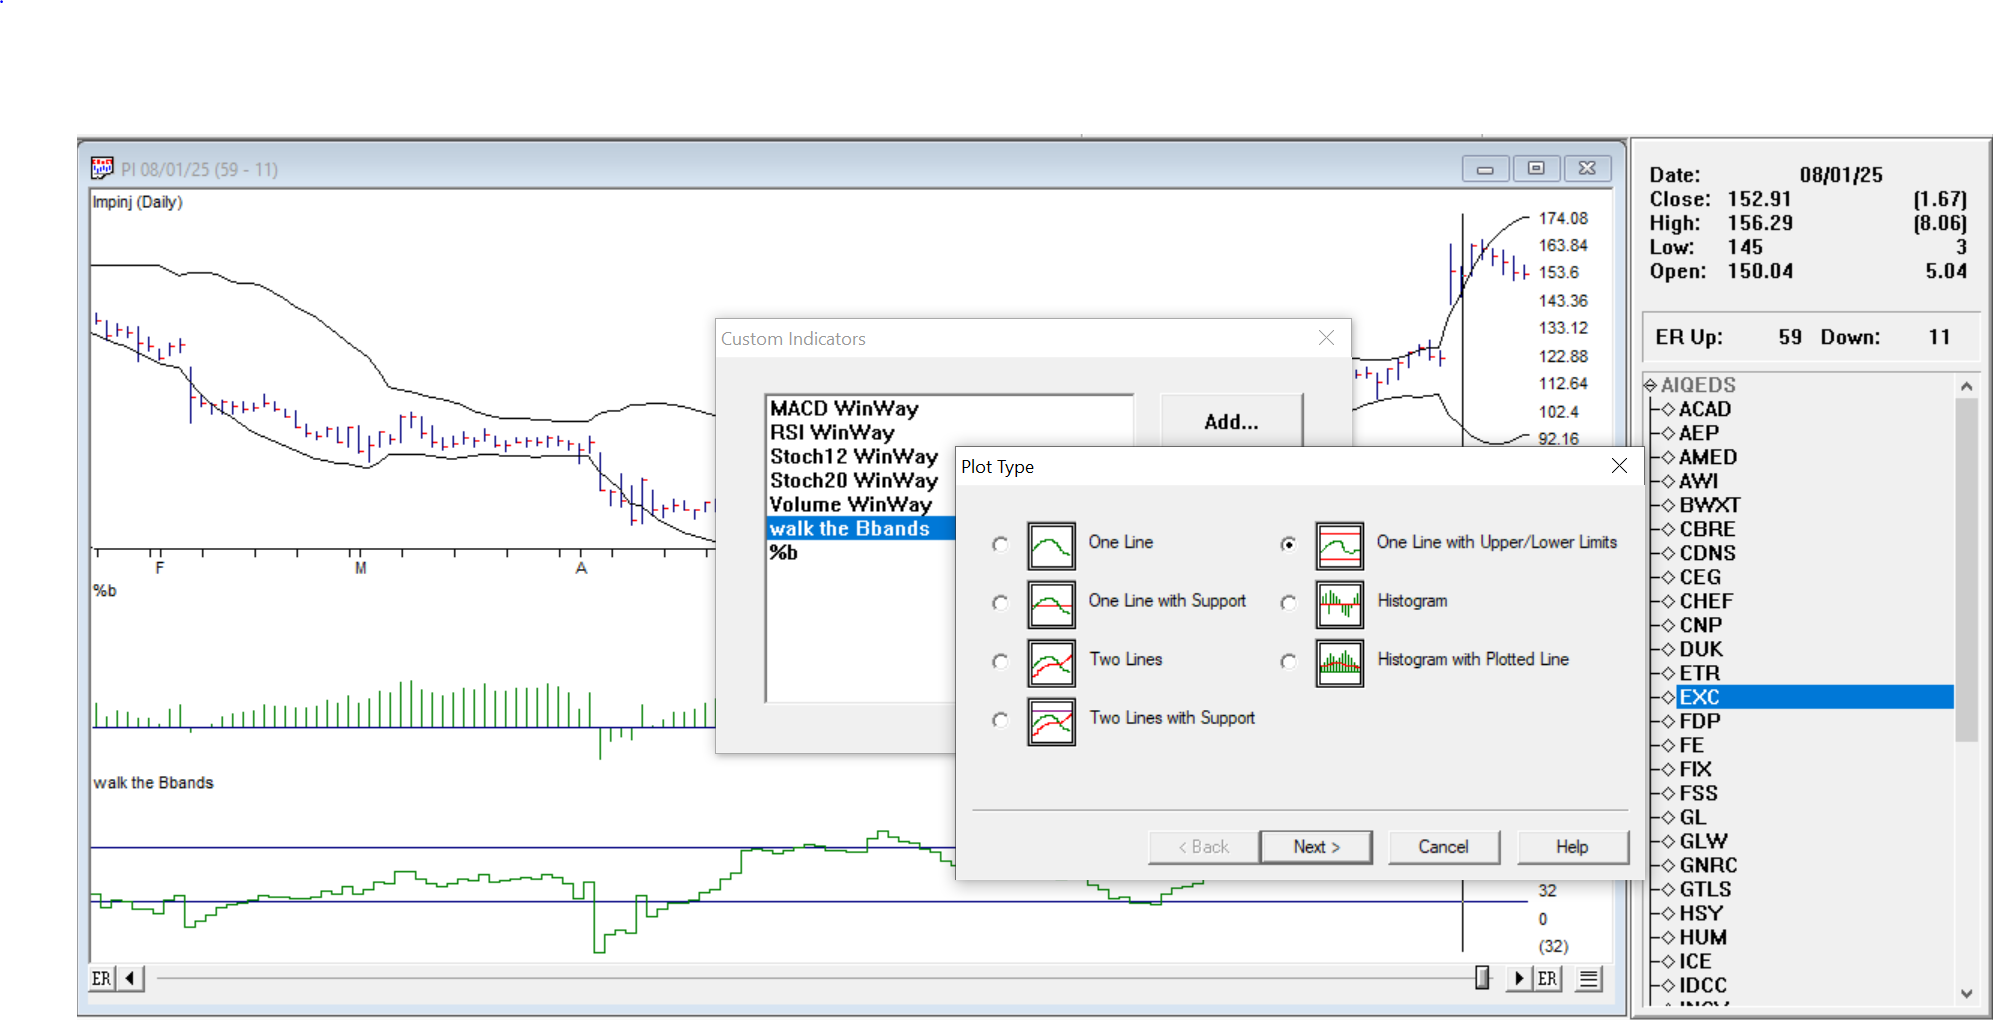
Repeat for the Walk the BBands but select Plot Type One Line with Upper/Lower Limits
Give it a Description/Name, then choose the UDF to Plot (Walkindicator) and select Upper Support 80, Lower Support 20.
Click Finish, then Done. Your new indicator now appears in the Indicator Library and can be added to charts like any other study.
Final Thoughts
%B adds mathematical precision to Bollinger Band analysis. Whether you’re hunting for reversals, breakouts, or just trying to understand volatility better, %B gives you an exact reading of the price’s location in the band structure.
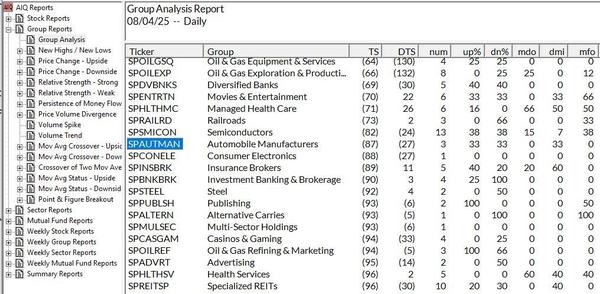
Knowing what the overall market is doing is useful — but knowing which sectors and industry groups are leading or lagging gives you tactical precision.
TradingExpert Pro’s Group/Sector module analyzes over 150 industry groups and 11 broad sectors. Each day, it assigns a score based on recent performance, momentum, and breadth.
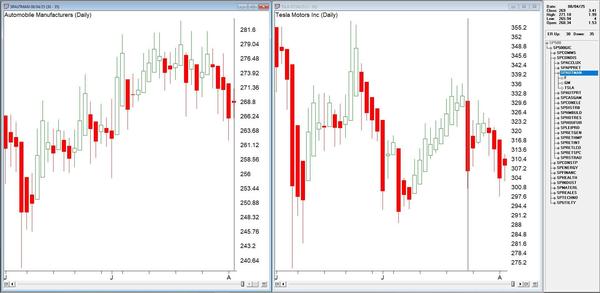
You can find top-ranked groups, then drill down to find the strongest stocks within them. This rotation-based approach keeps you on the right side of macro moves. When a group moves from lagging to leading (or vice versa), you’ll see it reflected in the daily scores.
Smart traders pair this with chart setups, AI ratings, and EDS strategies to align timing and selection. Sector rotation isn’t just for institutions anymore — TradingExpert Pro makes it usable for everyone.
👉 Start your 30-day trial of AIQ TradingExpert Pro. This is your chance to trade with the tools the pros use, system testing, backtesting, and expert ratings included.
In the highly competitive AI Trading Platform category of the 2025 Stocks & Commodities Readers’ Awards, AIQ TradingExpert Pro came in strong as 1st Runner Up — and we’re just getting started.
Why? Because serious traders know AIQ isn’t just software—it’s a full system for data-driven decisions. From smart Money Flow indicators to advanced market scanning and group/sector analysis, TradingExpert Pro gives you an edge in any market.
🌟 What sets us apart:
AI-enhanced signal generation
Backtesting and custom rule scripting
Personalized onboarding call with Steve Hill, AIQ’s CEO
With Trading Anchor Bill Olsen and Steve Hill, CEO of AIQ Systems.
In this episode of NewsWare’s AIQ Markets podcast, we explore the impact of recent tariff escalations on market volatility.
Host Emily Advani, along with experts Bill Olsen of NewsWare and Steve Hill, CEO of AIQ Systems, dive into how these developments affect various sectors, including retail, software, and soft drinks. Learn how traders can leverage both fundamental and technical analysis to navigate these turbulent times and uncover opportunities in stocks Nike (NKE) and Salesforce (CRM), amongst others. Tune in to gain valuable insights on staying ahead in an unpredictable market landscape.