Knowing what the overall market is doing is useful — but knowing which sectors and industry groups are leading or lagging gives you tactical precision.
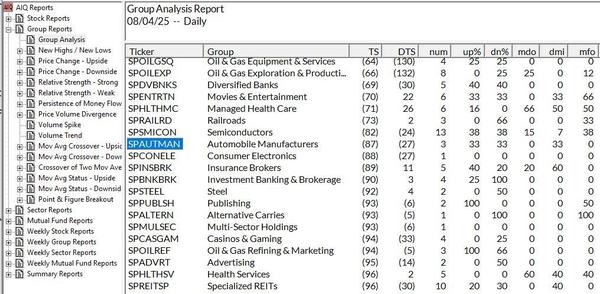
TradingExpert Pro’s Group/Sector module analyzes over 150 industry groups and 11 broad sectors. Each day, it assigns a score based on recent performance, momentum, and breadth.
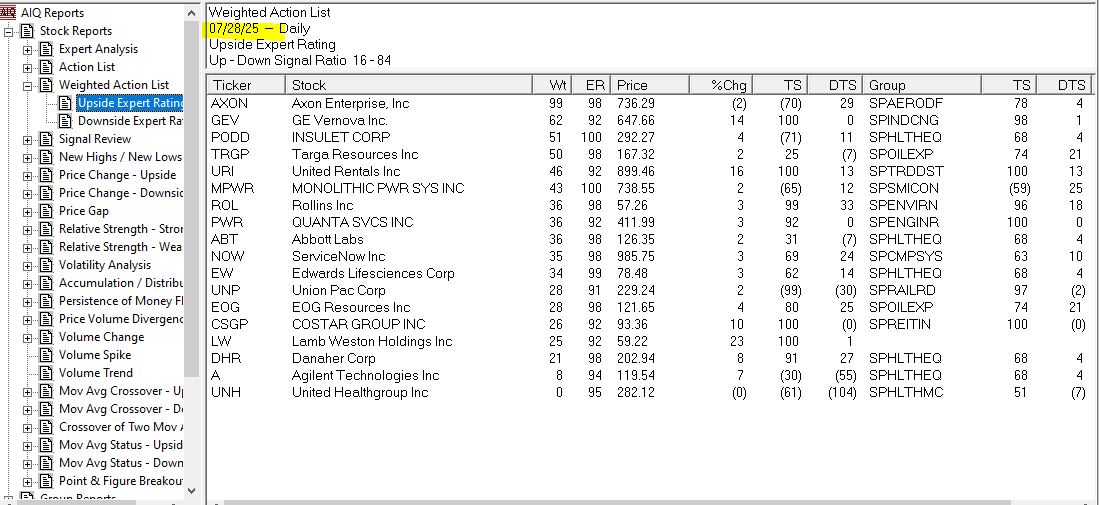
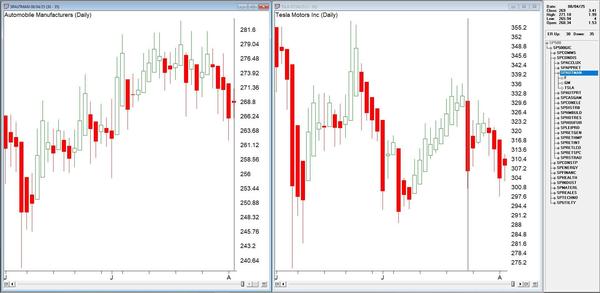
You can find top-ranked groups, then drill down to find the strongest stocks within them. This rotation-based approach keeps you on the right side of macro moves. When a group moves from lagging to leading (or vice versa), you’ll see it reflected in the daily scores.
Smart traders pair this with chart setups, AI ratings, and EDS strategies to align timing and selection. Sector rotation isn’t just for institutions anymore — TradingExpert Pro makes it usable for everyone.
👉 Start your 30-day trial of AIQ TradingExpert Pro. This is your chance to trade with the tools the pros use, system testing, backtesting, and expert ratings included.
Stay ahead of the market.
🏆 Traders Voted. AIQ Delivered

In the highly competitive AI Trading Platform category of the 2025 Stocks & Commodities Readers’ Awards, AIQ TradingExpert Pro came in strong as 1st Runner Up — and we’re just getting started.
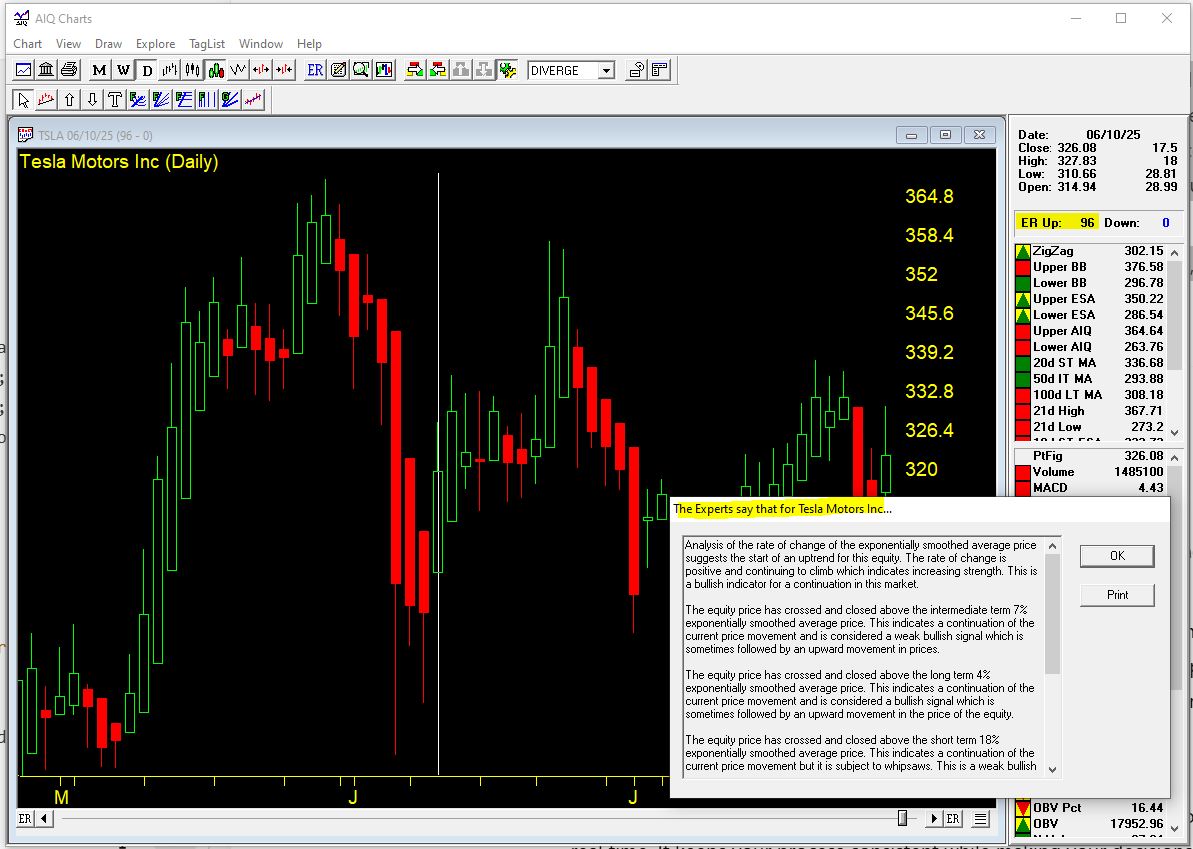
Why? Because serious traders know AIQ isn’t just software—it’s a full system for data-driven decisions. From smart Money Flow indicators to advanced market scanning and group/sector analysis, TradingExpert Pro gives you an edge in any market.
🌟 What sets us apart:
- AI-enhanced signal generation
- Backtesting and custom rule scripting
- Personalized onboarding call with Steve Hill, AIQ’s CEO
PLUS much much more…all the ins and outs are here https://aiqeducation.com/
👉 Grab the $1 30-day trial and take a serious step forward.