Averaging The Open And Close To Reduce Noise
The importable AIQ EDS file based on John Ehlers’ article in the March 2023 issue of Stocks & Commodities, “Every Little Bit Helps,” can be obtained on request via rdencpa@gmail.com. John notes ‘It’s simple but makes a noticeable improvement: You can reduce noise in the data by using an average of the open and close instead of using only the closing price.’ The code is also available below.
!Every Little Bit Helps
!Author: John F. Ehlers, TASC Mar 2023
!Coded by: Richard Denning, 1/12/2023
!Data Sampling Test
!(c) John Ehlers 2022
!INPUTS:
W1 is 14. !Wilder RSI length
W2 is 14. !Ehlers RSI length
!RSI Wilder code:
U is [close]-val([close],1).
D is val([close],1)-[close].
L1 is 2 * W1 – 1.
AvgU is ExpAvg(iff(U>0,U,0),L1).
AvgD is ExpAvg(iff(D>=0,D,0),L1).
RSIwilder is 100-(100/(1+(AvgU/AvgD))).
!Ehlers RSI code:
OCavg is ([open] + [close])/2.
Uoc is OCavg-valresult(OCavg,1).
Doc is valresult(OCavg,1)-OCavg.
L2 is 2 * W2 – 1.
AvgU2 is ExpAvg(iff(Uoc>0,Uoc,0),L2).
AvgD2 is ExpAvg(iff(Doc>=0,Doc,0),L2).
RSIoc is 100-(100/(1+(AvgU2/AvgD2))).
!CTest is RSIwilder.
!OCTest is RSIoc.
BuyRSIwilder if RSIwilder < 20 and valrule(RSIwilder >= 20,1).
ExitRSIwilder if RSIwilder > 80 or {Position days}>=20.
BuyRSIoc if RSIoc < 20 and valrule(RSIoc >= 20,1).
ExitRSIoc if RSIoc > 80 or {Position days}>=20.
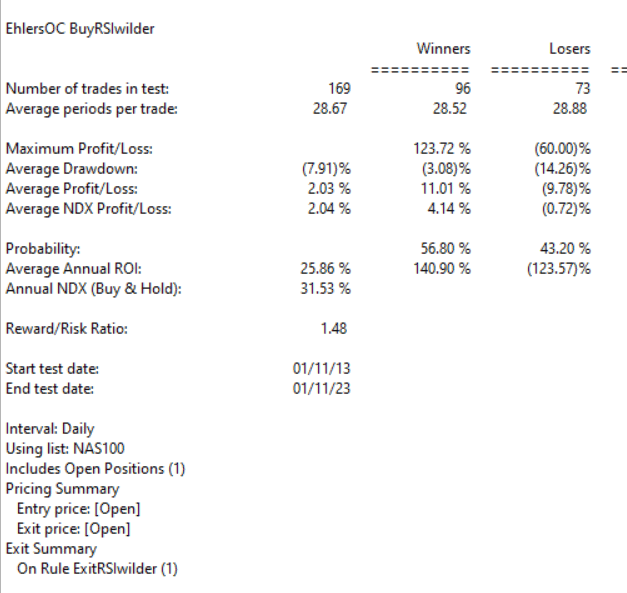
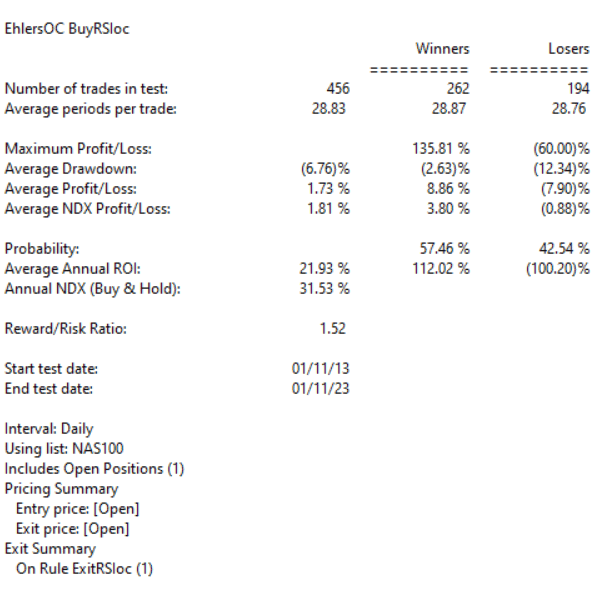
Code for the author’s indicators are set up in the AIQ EDS code file. Figure 7 shows the EDS module backtest results using the RSI original indicator. Figure 8 shows the EDS module backtest results using the modified version of the RSI indicator over a 10-year period using NASDAQ 100 stocks. The comparison suggests that some of the metrics improve using the modified version and a few are worse.
The system rules are:
- Buy when the RSI crosses down below 20
- Sell when the RSI crosses above 80 or after 20 trading days

FIGURE 7: AIQ. This shows example backtest results for classic RSI trading system rules, based on closing data, over a 10-year period using NASDAQ 100 stocks.

FIGURE 8: AIQ. This shows example backtest results for the RSI trading system rules, this time based on data that averages the open and close instead of using just the closing price data, over a 10-year period using NASDAQ 100 stocks.
—Richard Denning
rdencpa@gmail.com
for AIQ Systems

