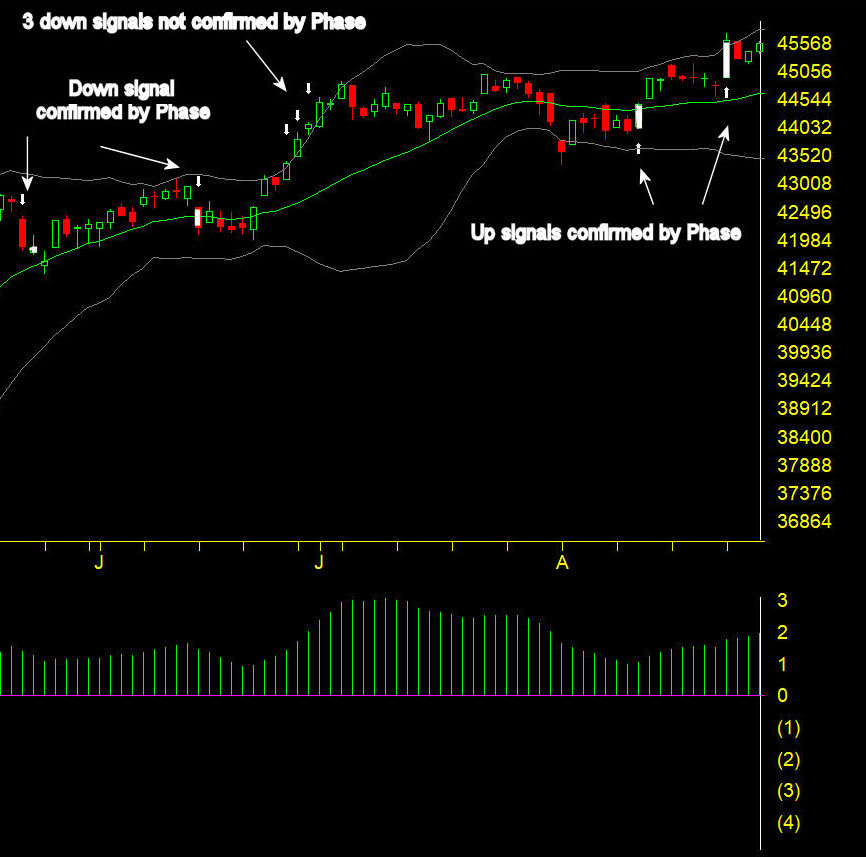
AIQ’s Market Timing Expert System has recently fired off three consecutive sell signals on September 19th, September 22nd, and September 30th, 2025. While the Dow Jones Industrial Average (DJIA) and broader market remain in an uptrend, the AI is warning that internal conditions beneath the surface are deteriorating.

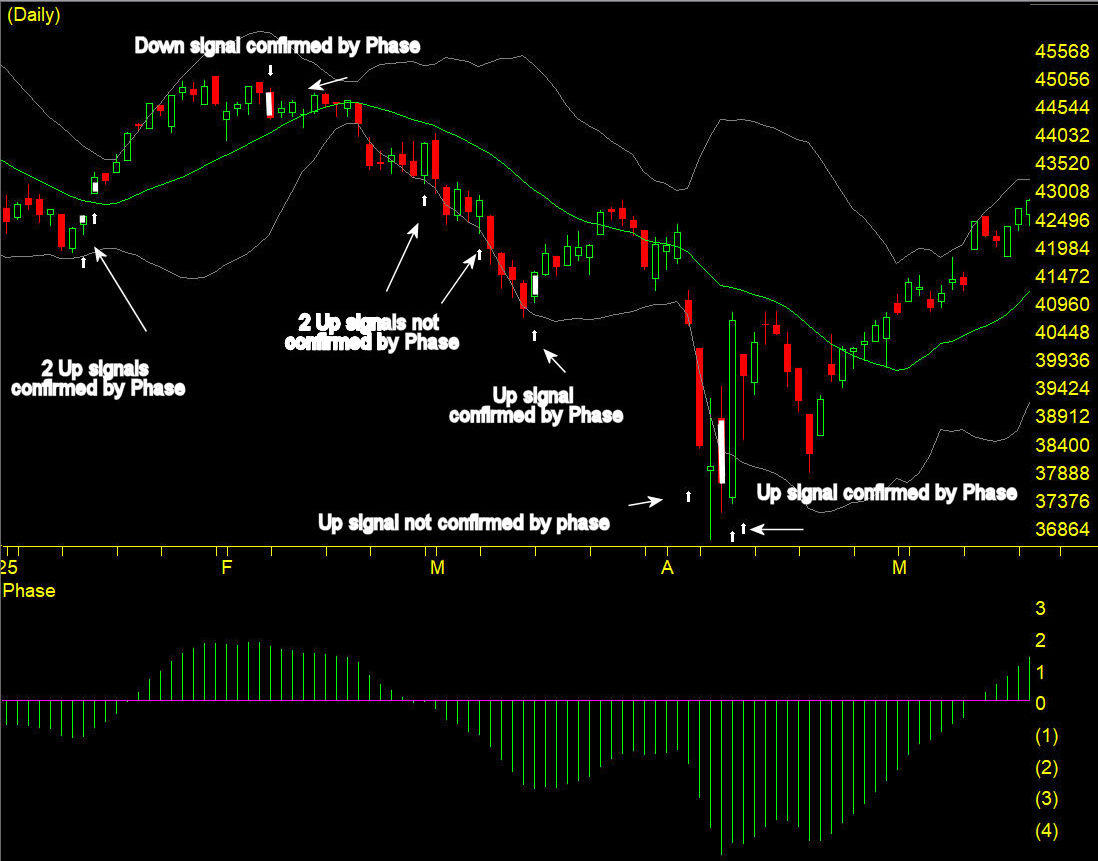
The visual representation below of the AI system on 9-30-25 on the market shows a broad bearish sentiment in the internal market indicators. In contrast, the Access Plot (all 500 of the SP 500 stocks measured by technical indicators) show the current bullish sentiment.

The Signals That Triggered
September 19th, 2025:
- Closing prices rose for three straight sessions on rising volume, a textbook bullish pattern. But beneath this strength, AIQ’s oscillators picked up negative divergences.
- The Advance/Decline Oscillator turned negative despite new 21-day highs in intraday prices – a classic warning that fewer stocks are participating in the rally.
- The Up/Down Volume Oscillator also flashed negative, signaling that selling pressure outweighs buying pressure even as prices tick higher.
September 22nd, 2025:
- The same divergence repeated: intraday highs at a 21-day peak, but both Advance/Decline and Up/Down Volume Oscillators stayed negative.
- Adding weight, the New High/New Low Indicator reversed to the downside – a reliable marker that momentum could be stalling, often ahead of trend reversals.
September 30th, 2025:
- Again, intraday highs hit a 21-day peak. Yet in a now sideways market, the Up/Down Volume Oscillator remained negative. This suggests distribution: institutions selling into strength rather than adding exposure.
Why the Signals Point Down
These warnings all point to the same underlying theme: the rally is narrowing, and internals are weakening. While prices look strong at the index level, breadth and volume indicators show stress beneath the surface. Historically, such divergences often precede a downturn, as buyers run out of fuel and sellers step in with force.
Why the Signals Are Often Early
It’s important to note that AIQ’s Expert System is designed to be early rather than late. By the time the majority of market participants “see” the decline, much of the downside has already occurred. The AI often highlights conditions that can lead to a reversal, but not necessarily on the very next day.
In practice, these signals function as yellow lights:
- They don’t always mean “sell everything immediately.”
- They do mean that traders should tighten risk controls, raise stops, and prepare for volatility.
If multiple signals cluster, as they have now, the probability of a corrective move rises.
What Traders Should Watch
Going forward, confirmation would come if:
- The DJIA breaks recent support levels on volume.
- Breadth and volume indicators continue to weaken.
- More new lows expand relative to new highs.
Until then, these sell signals are the market’s way of whispering a warning: the uptrend may not be as solid as it appears.
 | AIQ Systems Stephen Hill CEO |
Unlock the Six Secrets to Successful Trading – Get Your Free Guide Now

Most traders struggle because they don’t know the real secrets behind consistent profits https://aiqeducation.com/show-me-six-secrets/