The importable AIQ EDS file based on Vitali Apirine’s article in the June issue of Stocks & Commodities, “The Stochastic Distance Oscillator,” can be obtained on request via email to info@TradersEdgeSystems.com.
Vitali’s new variation on the classic stochastic oscillator, is based on price maxima and minima over a range of days. It indicates overbought and oversold levels and helps to identify bull and bear trend changes.
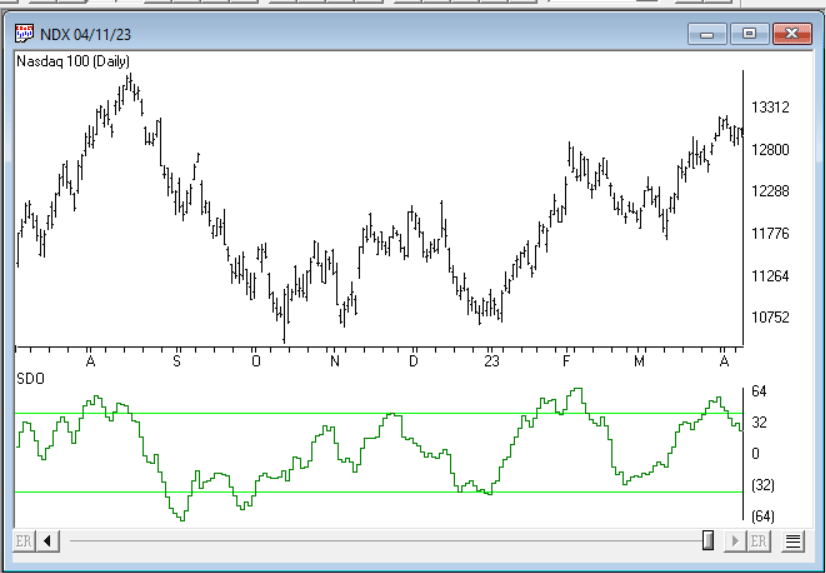
Code for the author’s indicator is set up in the AIQ EDS code file. The code is also shown below. Figure 11 shows a chart of the NASDAQ 100 index (NDX) with the SDO[200,12,3] indicator (green jagged line).
!The Stochastic Distance Oscillator
!Author: Vitali Apirine, TASC June 2023
!Coded by: Richard Denning, 4/15/2023

LBPeriod is 200.
Period is 12.
Pds is 3.
C is [close].
Dist is abs(C-valresult(C,period)).
D is (Dist - lowresult(Dist,LBPeriod))/
       (highresult(Dist,LBPeriod)-lowresult(Dist,LBPeriod)).
DD is iff(C>valresult(C,Period),D,iff(C<valresult(C,Period),-D,0)).
SDO is expavg(DD,Pds)*100.

FIGURE 11: AIQ. Here, the stochastic distance oscillator (SDO) indicator is shown on a chart of the NASDAQ 100 index (NDX). The SDO[200,12,3] indicator is the green jagged line.
—Richard Denning
rdencpa@gmail.com
for AIQ Systems

