In this short video we’ll discuss the last 4 AI ratings on the Dow Jones Industrial average and examine the rules that fired to generate these signals.
AIQ TradingExpert Pro is programmed with the knowledge and insight of respected technical analysts, experts who have developed technical analysis indicators and systems for the last 50 years. The up/down timing signals issued by TradingExpert Pro are based on this knowledge. Since TradingExpert Pro’s timing signals are generated on a scientific basis, free of bias or emotion, you get a disciplined, objective approach to stock market timing.
The timing signals produced by the AIQ expert system are in the form of Expert Ratings. Behind each Expert Rating is a set of rules that combine the sound principles of technical analysis with the experience of market professionals. Since no single technical indicator works all the time, using indicators in combination increases their reliability. For example, a rule is developed that combines the readings of two or more indicators. This
rule is then more reliable than the reading of a single indicator. Within TradingExpert Pro are two knowledge bases, one specifically designed to issue market timing signals and the other designed to issue stock timing signals. Each TradingExpert Pro knowledge base contains approximately 400 rules, but only a few “fire” on any given day.
In the language of expert systems, those rules that are found to be valid on a particular day are described as having “fired”. Rules can fire in opposite directions. When this happens, the bullish and bearish rules fight it out. It’s only when bullish rules dominate that the Expert Rating signal is bullish, or when bearish rules dominate that the Expert Rating signal is bearish.
December 20, 2021 we published this seasonality article on the Santa Claus rally https://aiqeducation.com/tis-the-season-to-be-cautious/. In a nutshell we looked at the last 5 trading days of the year and the first 2 trading days of the next year. We looked back over the last 7 years to see if the rally holds up.
The Dow clearly did show an average rally of over 1% during those 7 trading days.
So how did things go this Santa Claus rally?
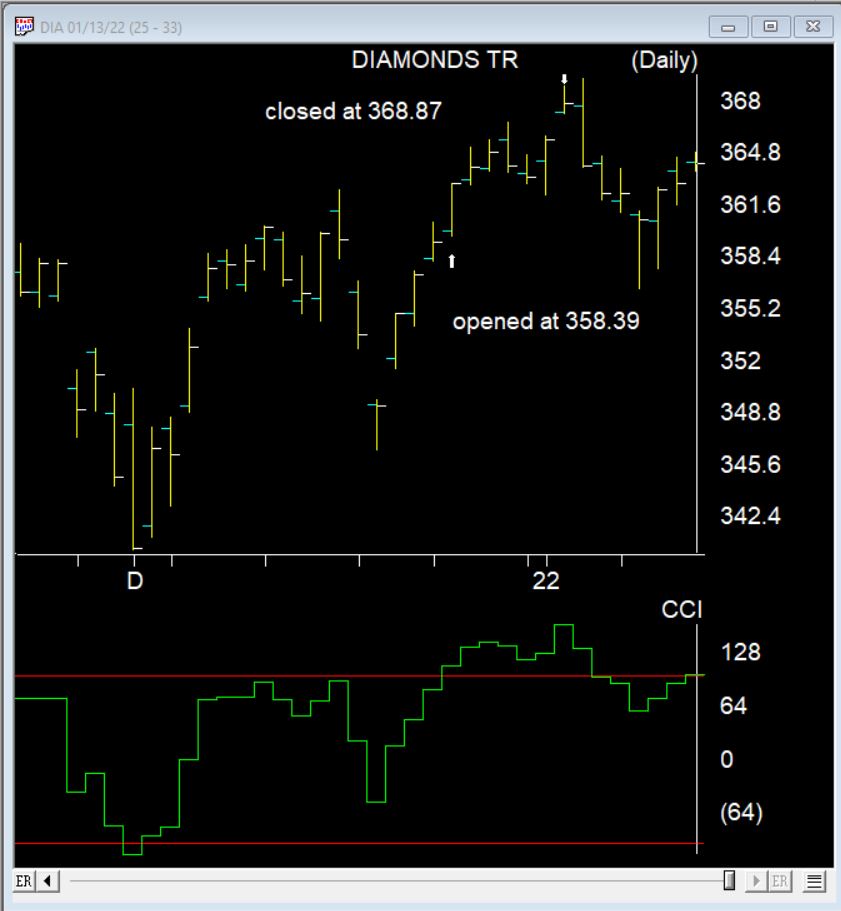
Here’s the DIA the ETF that follows the Dow during the 7 day Santa Claus rally. It made a nice gain of 2.9%. 2 days later things turned down.
Happy New Year! As the new Year starts let us look at 2021 which was a good year for the stock market, especially the S&P 500 which gained 28% mostly because of the mega giant stocks like Apple, Microsoft, Google etc. The fast-growing disruptor stocks that did so well in 2020, rising hundreds of percent were down in 2021. There were many panic situations and moments during the year and many challenges, including the highest inflation in decades, Covid 19, and supply chain issues causing shortages. Prices for houses continued to soar and this all leads to the biggest concern being elevated Inflation. In addition, most of the asset prices, including stocks and other assets, especially many of the largest companies, real estate, and other assets are in bubble territory.
The biggest unknown is how long the current bout of inflation will last and how is the Federal Reserve going to deal with it. The Fed was very dovish on inflation over the last year, but over the last couple of weeks they have become much more hawkish. This is one of the reasons the stock market has gotten hit over the first few days of 2022. Therefore, the Treasury yields have risen a good deal in the first week of 2022. There are other concerns that will affect 2022 like the mid-term elections, earnings growth, covid, international threats from China and Russia. That said, with so many things going, the two major factors that cause stocks to rise over the long term are:
Earnings and interest rates.
If earnings rise 5 to 10% per year or more and interest rates stay relatively low, the stock market as a whole should rise. But if earnings slow or go negative and interest rates rise to a point where people put their money in fixed accounts then by the competitive nature of investments the market will fall. When you look at the stock market over the long term, it has been one of the best classes in which to invest rising about 9-10% per year. With earnings expected to rise 7% or more and interest rates expecting to rise 3 times in 2022, volatility should rise over the next few months. Currently, the large tech stocks are expensive right now. I like cyclical stocks like consumer discretion stocks, financials that do well as interest rates rise, small cap value, dividend stocks, floating rate bonds, and international stocks that do well as the dollar falls, and more in the value sector. Dividend stocks generally are a buffer to the downside of the market somewhat. In addition, there are many ways to reduce risk now in the market or to hedge. Bonds other than Inflation protected bonds or floating rate are a Sell.
Finally, we will always have walls of worries about the markets and investing, and that is what makes the market direction unpredictable and uncertain. That is why it is important that we should always look at your long-term plan and not on the day-to-day gyrations of the market. Volatility will always happen, year to year. The only thing we can guarantee that will happen in the market is uncertainty and volatility.
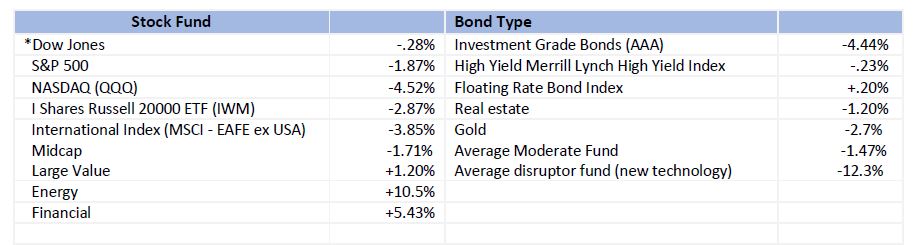
Some of the INDEXES of the markets both equities and interest rates are below. The source is Morningstar.com up until January 7, 2022
S&P 500
Support on the S&P 500 is 4660, 4540, 4361 and 4288. Support on the Dow is 35969, 34885, 34072, and 33503. Support on the NASDAQ is 15509, 14929, and 14415.
These are areas that the markets could turn and long term investors may want to add to their positions. They are areas not specific numbers.
BOTTOM LINE
The markets in the first week of 2022 have been volatile. The technology stocks are taking it on the chin while the value and dividend stocks are rising. I think the value, discretionary stocks as well as energy and financials look good currently and going forward into the year. Interest rates will go higher, With the Federal Reserve pumping money into the markets any large decline in the markets should be short lived. Covid pressures should be nearly over this year and earnings should go higher. But I do expect more volatility this year that could see the markets dropping 10% or more. By the end of the year, I expect the markets to be somewhat higher, but there are very tough earnings hurdles to overcome. Bonds are on the Sell block except floating rate bonds and Treasury Inflation protected bonds. If you haven’t spoken with me in the last 6 months, please call me. Now more than ever this is very important. Call me at 860-940-7020.
Joe Bartosiewicz, CFP® Investment Advisor Representative
92 High Street Thomaston, CT 06787
Securities and advisory services offered through SagePoint Financial, Inc. (SPF), member FINRA/SIPC. SPF is separately owned and other entities and/or marketing names, products or services referenced here are independent of SPF. 800-552-3319 20 East Thomas Road Ste 2000 Phoenix AZ 85012
Disclaimer: The views expressed are not necessarily the view of Sage Point Financial, Inc. and should not be interpreted directly or indirectly as an offer to buy or sell any securities mentioned herein. Securities and Advisory services offered through Sage Point Financial Inc., Member FINRA/SIPC, an SEC-registered investment advisor.
Past performance cannot guarantee future results. Investing involves risk, including the potential loss of principal. No investment strategy can guarantee a profit or protect against loss in periods of declining values. Please note that individual situations can vary. Therefore, the information presented in this letter should only be relied upon when coordinated with individual professional advice. *There is no guarantee that a diversified portfolio will outperform a non-diversified portfolio in any given market environment. No investment strategy, such as asset allocation, can guarantee a profit or protect against loss in periods of declining values. It is our goal to help investors by identifying changing market conditions. However, investors should be aware that no investment advisor can accurately predict all of the changes that may occur in the market.
This time of year you might expect us to be thinking about the Santa Claus rally, but after the beating we’ve had the last few days, lets check and see how effective this really is.
What Is a Santa Claus Rally?
I lifted this description from Investopedia
A Santa Claus rally describes a sustained increase in the stock market that occurs in the last week of December through the first two trading days in January. There are numerous explanations for the causes of a Santa Claus rally including tax considerations, a general feeling of optimism and happiness on Wall Street, and the investing of holiday bonuses. Another theory is that some very large institutional investors, a number of which are more sophisticated and pessimistic, tend to go on vacation at this time, leaving the market to retail investors, who tend to be more bullish.
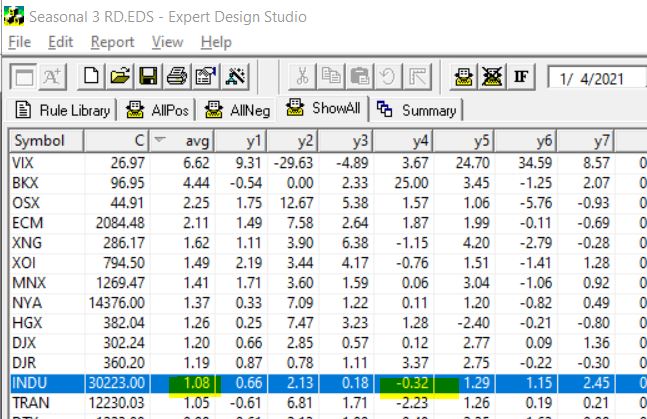
To test this in Expert Design Studio, I used the Seasonality3 ED built-in strategy. I set the Season Length days to 7 days to encompass the last 5 trading days of December and the first 2 days in the New Year.
By setting the date to 1/4/21, the rule looks back 7 trading days from January 4th, each of the last 7 years and gives us an approximate percentage return for each of those 7 days.
Some years with weekends and extra holiday days plus 252 is used as default trading days skew results a small amount. To compensate I also tested 10 trading days back from January 7. The results from the 7 days are below, I tested all the indices in my current database.
INDU is highlighted, this is the Dow 30 index. First it’s clear that in every year except for one, over the last 7 years the Dow has made gains in the Santa Claus period. The average gain Is over 1%. Not too bad for a 7 day trading period. BTW the results from the 10 days from January 7 were similar.
The NASDAQ on the contrary had 3 losing years out of the 7.
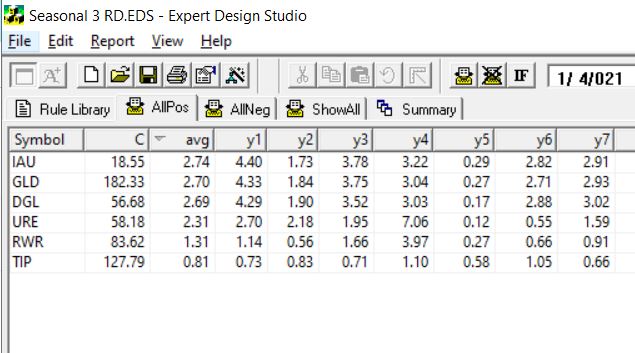
So next I decided to look at what ETFs are most likely to have a Santa Claus rally. Here’s the results using the 7 trading days back from Jan 4. This is the ETFs that had gains every year for the last 7.
The first 3 ETFS are all Gold related, the next two are real estate/REITs the last one is a bond fund. Hmm something to keep in mind.
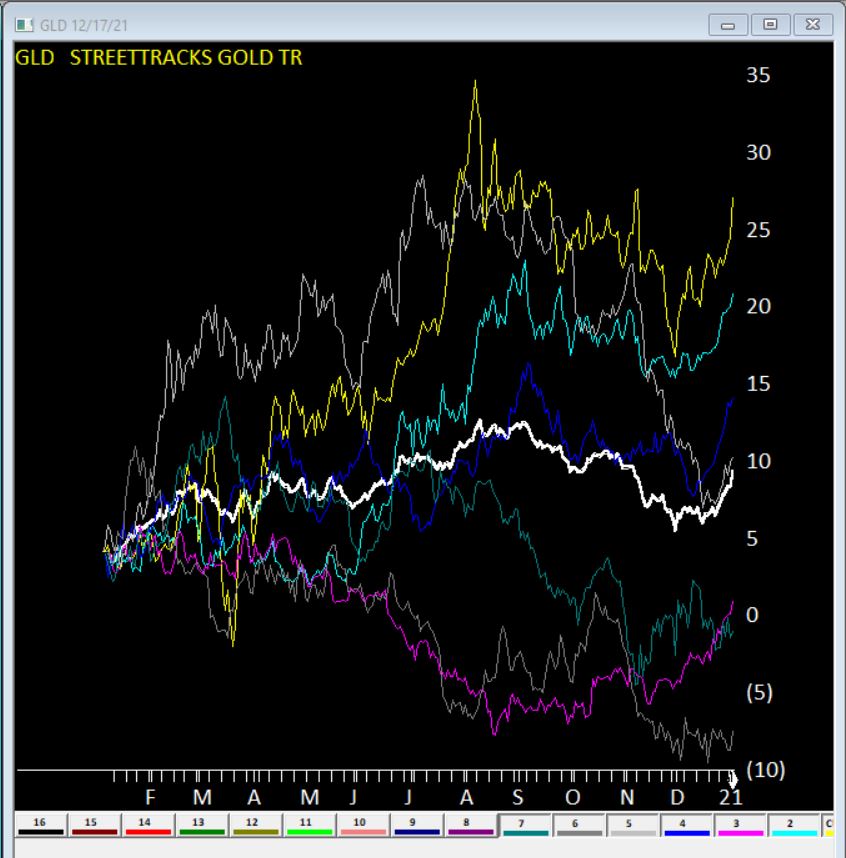
Here’s GLD seasonal charts the right hand side of each year shows the Santa Claus rally clearly. The White line is the average of all 7 years.
Clearly no guarantees what will happen this year, but something to keep in mind.
As stated on the Bartometer on October 10th we were getting Buy signals, and the market was oversold and a good buy at that time. On November 10th, I noted that the market was too overbought and not to put any substantial money into the market. From that point until now the markets fell 5-10%. This month we have dropped to a point where the market is getting cheaper but not enough to start to invest large amounts of money into the market yet. Dollar cost averaging is fine, but not large amounts of money. There may be a Santa Claus that usually, but not always starts on the 15th of December. With COVID and inflationary problems, this may or may not come to fruition.
What caused the problem when the market is normally in seasonal strength? Omicron, (the new COVID variant), the Federal Reserve tightening money supply, and the market was 34% overvalued that Both Dr. Robert Genetski and I have been saying for months. In addition, the stocks which have been the best performers this year have been the mega large cap stocks like Apple, Microsoft, Google, Energy, Financial and more and the worst stocks have be the Very Aggressive stocks that were up so much last year like Zoom, DocuSign, Shopify etc. Investors, short term, have been more interested in earnings and reasonably valued stocks than stocks with aggressive revenue growth and high valuations. I still like the aggressive stocks but they are more volatile. The market is now overvalued 30% based on earnings and interest rates.
The economy is doing relatively very well and should continue to do so for a while, but next year I can see the economy having a harder time with earnings growth expected to grow 7-9%. Next year I see interest rates rising and the stock market rising 6-9% possibly, but there could be a monkey wrench thrown in the mix if inflation and interest rates rise more dramatically. In light of this I, am looking at BUFFERED ETFs (Exchange Traded Funds) that give the investor a cap on the upside. These are investments that cap the upside of the market, and give you a buffer on the downside. So, for example, if the market goes up 10%, you make 7-8%, but if the market goes down 15%, you don’t lose anything. If the market falls more than 15%, like 20%, you would lose 5%. These are interesting to me now because we again have to look at risk versus reward. What makes these ETF’s of more interest is that these are one year ETF holds.
Energy investments, financial stocks, reasonably valued stocks, technology still look okay for investments and I still like floating rate bonds if the economy is doing well during this period of inflation. Inflation protected bonds also do very well in an inflationary environment. Long term, 5 to 10 years, it’s about artificial intelligence, electric vehicles, technology and more. These are high risk, but high potential growth. In 2022, investors should be looking at more value and growth at a reasonable price.
Listed below are some of the INDEXES for both the equities and interest rate markets. The source is Morningstar.com up until December 4, 2021.
Dow Jones +14.94% S&P 500 +22.47% EQUAL WEIGHTED S&P 500 +22.4% NASDAQ Aggressive growth +22.5% Large Cap Value +19.75% I Shares Russell 2000 ETF (IWM) Small cap +10.21% Midcap stock funds +18.4% International Index (MSCI – EAFE ex USA +7.22% International Emerging Markets -4.91% Financial stocks +30.6% Energy stocks +50% Healthcare Stocks +14% Investment Grade Bonds (AAA) Long duration -1.5% High Yield Merrill Lynch High Yield Index +2.19% Floating Rate Bond Funds +3.77% Short Term Bond -1.0% Multi sector bond funds +2.4% Gold -6.58% 10 year Bond Yield 1.34% Moderate Fund +9.0% Average Disruptor Fund Aggressive growth -1 to -37%% big drop last month
Dr. Robert Genetskis Economic Excerpts
Market Outlook
Stocks moved sharply lower this week as popular indexes fell 2½% to 5½%. Large cap indexes were down 3%, while small caps fell 5%.
The main cause appears to be the emergence of Omicron, the latest COVID variant. Research worldwide shows lockdowns to be they are the worst of all responses, both in terms of overall impact on health as well as the economy.
Unfortunately, our health officials have not used either science or logic in dealing with COVID. As a result, there is no telling if they will now behave any differently. The fate of economy and, therefore the stock market, remains in the hands of what has been incompetent policymakers. It’s doubtful we’ll see lockdowns, but predicting their response is difficult.
The good news for stocks is the Fed continued to pour money into the economy in November. This will boost stocks, spending and inflation well into next year.
Although Fed Chair Powell indicated the Fed could halt purchases of securities before mid-year. This policy change is unlikely to slow the Fed’s stimulus.
Technical stock market indicators are more negative than positive. Yesterday, all of the major indexes closed above key resistance levels, which is certainly positive. However, trading volume has been lower on up days and stronger on down days, the opposite is true in strong, healthy markets.
Offsetting pressure from more money sending stock prices higher to concerns over the government
A Look Back Today’s employment report indicated private payrolls increased by 235,000 in November. Even so, the number of jobs remains 2% below its pre- COVID peak. Average hourly earnings rose at a 10% annual rate. Economic Fundamentals: neutral
Stock Valuation: S&P500 over-valued 3
Economic Fundamentals: neutral
Stock Valuation: S&P500 over-valued 30%
Monetary Policy: expansive
Recommended Stock Exposure: 80%
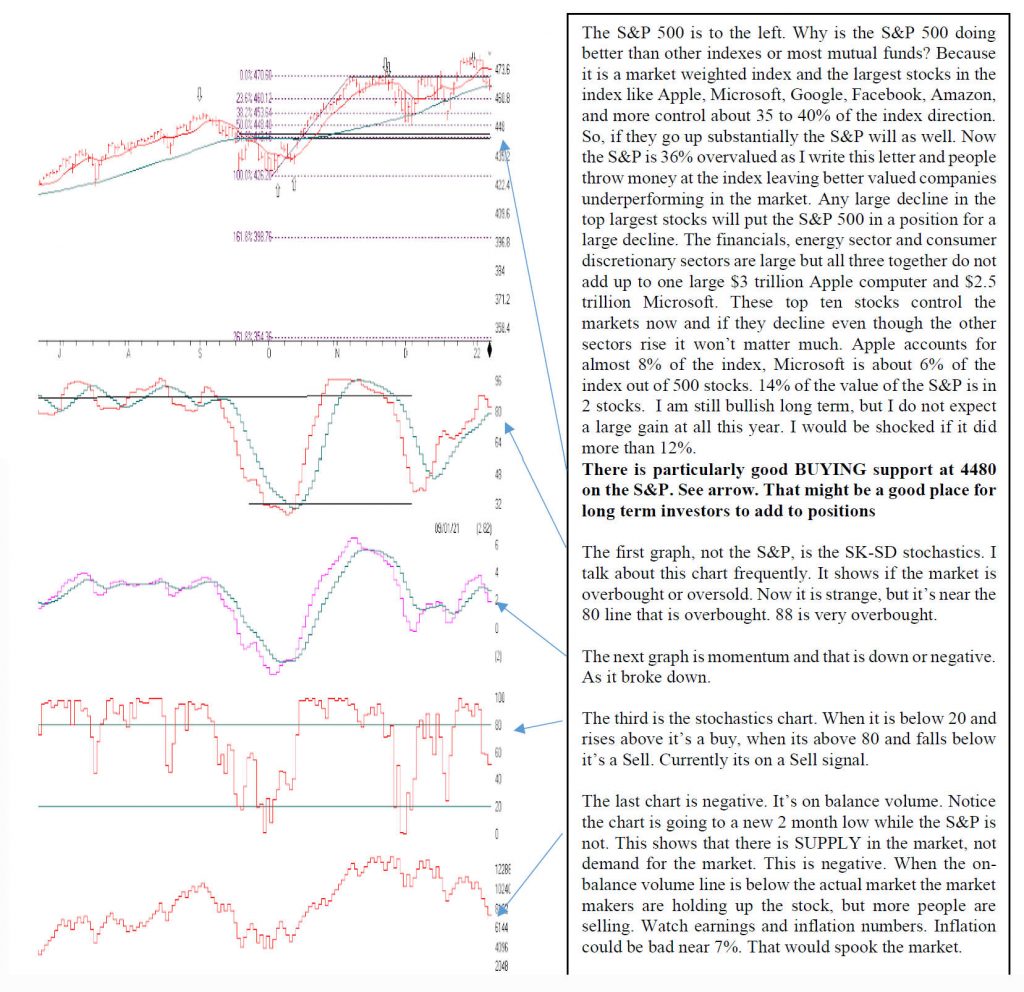
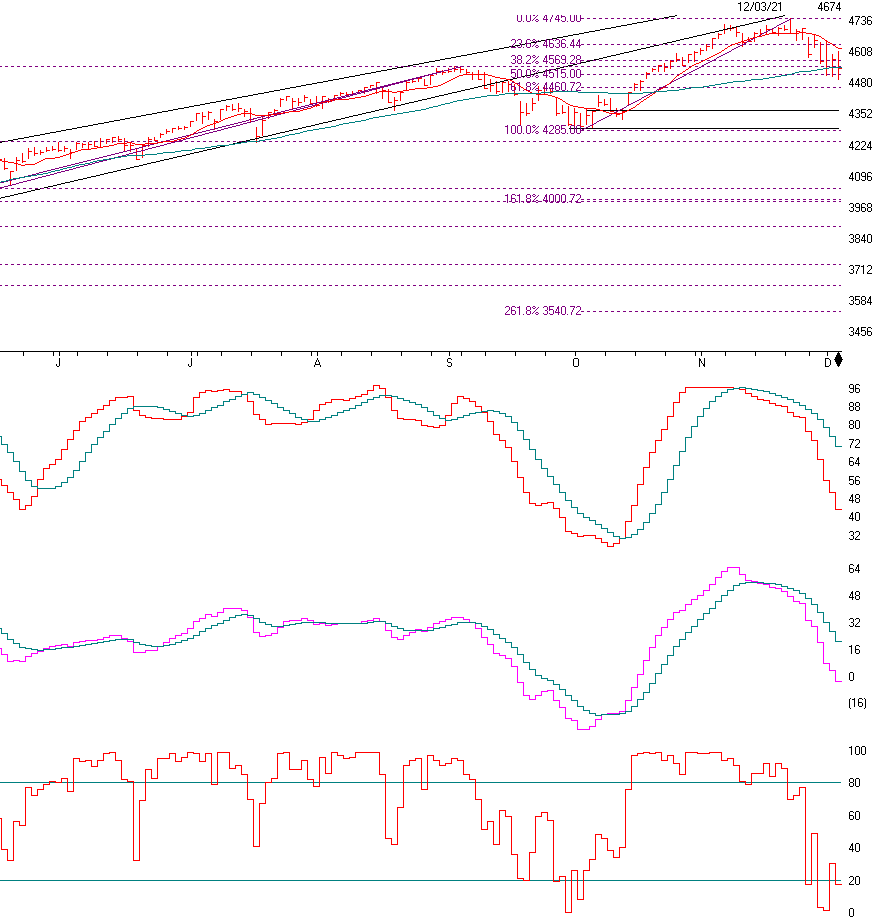
Above is the S&P 500, the index of the largest blue chip stocks that are based on market value. I have been putting in the short term buy and sell arrows on the chart as you can see on the left. As you can see, there were two Sells in late August, two Buy signals in early October 10th and two Sell signals in mid to late November. On November 10th we were still on BUY–Hold signals but I said do not Buy because the market technicals were too overbought and extended as seen by the indicators above.
The first one was the SK-SD Stochastic chart. Last month I said the SK-SD Stochastic was over 88 and is now too over bought and not said not to buy. On October 10th I said the SK-SD Stochastic was under 32 and the market was cheap and we were giving BUY signals. Now with the selloff we are now getting near the 32 zone again where the market is starting to get over sold and it MIGHT be putting in a BUY zone. We need to analyze every day.
The next chart is the MACD, or Momentum model. This also shows when momentum is topping and turning north or south. When the red crosses above the blue it’s a preliminary BUY, and when it crosses from the upside below the blue line it’s a preliminary Sell. This is one of 15 things I look at to determine a buy or a sell signal.
Stochastics is the last chart and the Buy signal is given when the red line goes above the 20 and the sell is when it crosses above the 80 and that’s what it gave on 11.22.21 on HIGHER volume. We got short term sells on that day. See the red bars.
Now that the S&P is down and you want to know where there might be a short term bottom. Let’s look at where there could be Buying support. The S&P has buying support levels at: 4515, 4460, 4305, (200 day moving average), and 4285, and 4001.
CHART SOURCE: AIQSYSTEMS.COM
Support levels on the S&P 500 area are 4515, 4460, 4305, 4285, and 4001. Resistance is at 4636 NASDAQ support levels are 15,068, 14,857, 14,174 and 13,069 These may be safer areas to get into the equity on support levels slowly on the accumulation areas.
THE BOTTOM LINE:
After the market rallying for most of the year, it sold off hard over the last three weeks, especially the small to mid-cap and the very aggressive stocks. Over the long term, (5 years to 10 years) these stocks exhibit 20- 40% per year revenue growth and are the future, but are very volatile. The market is still in seasonal strength, but the COVID situation and inflation problems are rearing their ugly heads. I like large cap growth as well as small value and financials. Artificial intelligence should be one of the fastest growing sectors over the next 10 years
Best to all of you, Joe Bartosiewicz, CFP® Investment Advisor Representative Contact information:
Joe Bartosiewicz, CFP®
92 High Street
Thomaston, CT 06787
Securities and advisory services offered through Sagepoint Financial, Inc. (SPF), member FINRA/SIPC. SPF is separately owned and other entities and/or marketing names, products or services referenced here are independent of SPF. 800-552-3319 20 East Thomas Road Ste 2000 Phoenix AZ 85012
Technical Analysis is based on a study of historical price movements and past trend patterns. There is no assurance that these market changes or trends can or will be duplicated shortly. It logically follows that historical precedent does not guarantee future results. Conclusions expressed in the Technical Analysis section are personal opinions: and may not be construed as recommendations to buy or sell anything.
Disclaimer: The views expressed are not necessarily the view of Sage Point Financial, Inc. and should not be interpreted directly or indirectly as an offer to buy or sell any securities mentioned herein. Securities and Advisory services offered through Sage Point Financial Inc., Member FINRA/SIPC, an SEC-registered investment advisor.
Past performance cannot guarantee future results. Investing involves risk, including the potential loss of principal. No investment strategy can guarantee a profit or protect against loss in periods of declining values. Please note that individual situations can vary. Therefore, the information presented in this letter should only be relied upon when coordinated with individual professional advice. *There is no guarantee that a diversified portfolio will outperform a non-diversified portfolio in any given market environment. No investment strategy, such as asset allocation, can guarantee a profit or protect against loss in periods of declining values.
It is our goal to help investors by identifying changing market conditions. However, investors should be aware that no investment advisor can accurately predict all of the changes that may occur in the market.