Category Archives: Mutual funds

When to Buy Energy Stocks

Crude oil and pretty much the entire energy sector has been crushed in recent months. This type of action sometimes causes investors to wonder if a buying opportunity may be forming.

The answer may well be, “Yes, but not just yet.”

Seasonality and Energy

Historically the energy sector shows strength during the February into May period.  This is especially true if the November through January period is negative.  Let’s take a closer look.

The Test

If Fidelity Select Energy (ticker FSENX) shows a loss during November through January then we will buy and hold FSENX from the end of January through the end of May.  The cumulative growth of $1,000 appears in Figure 1 and the yearly results in Figure 2.

1

Figure 1 – Growth of $1,000 invested in FSENX ONLY during Feb-May ONLY IF Nov-Jan shows a loss

2

Figure 2 – % + (-) from holding FSENX during Feb-May ONLY IF Nov-Jan shows a loss

Figure 3 displays ticker XLE (an energy ETF that tracks loosely with FSENX).  As you can see, at the moment the Nov-Jan return is down roughly -15%.

3

Figure 3 – Ticker XLE (Courtesy AIQ TradingExpert)

All of this suggests remaining patient and not trying to pick a bottom in the fickle energy sector. If, however, the energy sector shows a 3-month loss at the end of January, history suggests a buying opportunity may then be at end.

Summary

Paraphrasing here – “Patience, ah, people, patience”.

Jay Kaeppel

Disclaimer:  The data presented herein were obtained from various third-party sources.  While I believe the data to be reliable, no representation is made as to, and no responsibility, warranty or liability is accepted for the accuracy or completeness of such information.  The information, opinions and ideas expressed herein are for informational and educational purposes only and do not constitute and should not be construed as investment advice, an advertisement or offering of investment advisory services, or an offer to sell or a solicitation to buy any security.

Prepare to Bounce

2018 sure was a great year for the stock market.  For almost a month anyway.  Since then, not so much.  And on the heels of last week’s selloff a lot of pundits and prognosticators are suggesting more loudly that the Great Bull Run is dead. And maybe they are right.  But maybe not.

It is almost always a mistake to hang your hat on one indicator to guide your actions going forward.  But at the same time, sometimes one indicator generates a signal so clear it perhaps should grab your attention.  Let’s look at one that is on the verge of sending an important signal.

The VixRSIRatio Indicator

This is an indicator that I developed a number of years ago by basically – I am going to use some highly technical terms here to describe the process I followed so please try to stay with me – mashing together several other indicators from other people.  If you are interested in the actual calculations they appear at the end of the article.  For now, just know that I refer to it as VixRSIRatio.  As I follow it, it gives meaningful signals very infrequently.  But that is OK as the signals it does give often prove to be useful.

For our purposes we will apply it to ticker SPY – an ETF that tracks the S&P 500 Index. The rule is simple:

*A “Bullish Alert” occurs when VixRSIRatio drops to -210 or below and then turns up.

That’s it. Now please note the use of the phrase “Bullish Alert” and the lack of the words “You”, “Can’t” and “Lose”, as well as the lack of the phrase “by putting all of your money in the market at the exact moment a signal occurs.”

This is key.  Also note that there is nothing “magic” about the value -210. Nothing scientific about it. It just seems like a useful cutoff.  Now let’s look at the “Bullish Alert” signals in recent years.  They appear in Figures 1 through 4.

1

Figure 1 – Jay’s VixRSIRatio; 2014-2018 (Courtesy AIQ TradingExpert)

2

Figure 2 – Jay’s VixRSIRatio; 2010-2013(Courtesy AIQ TradingExpert)

3

Figure 3 – Jay’s VixRSIRatio; 2006-2009 (Courtesy AIQ TradingExpert)

4

Figure 4 – Jay’s VixRSIRatio; 2001-2005 (Courtesy AIQ TradingExpert)

As you can see in Figures 1 through 4:

a) Readings below -210 tend to be followed by – at the least – decent trading opportunities.

b) Often these readings presage significant market advances

c) And alas, sometimes the signals come too soon and/or are not followed by much of an advance.

The Here and Now

As of 3/23/18 the VixRSIRatio for ticker SPY stood -354.  So clearly “Buy Alert” is at hand.  So the obvious question is “What comes next”?  Will it be a, b, or c above?

As always, time will tell.

Calculations

In a nutshell, VixRSIRatio combines Larry Williams’ Vixfix indicator with Welles Wilder’s 3-day and 14-day RSI indicators to create two more indicators – VixRSI3 and VixRSI14.  We then divide VixRSI3 by VixRSI14 and invert the whole thing (so that we get an indicator that gives negative readings when the market goes down).

Now you see why I put this at the end….

Below is the code for AIQ Expert Design Studio

############## Larry Williams Vixfix #################

xx is 15.

hivalclose is hival([close],22).

vixfix is (((hivalclose-[low])/hivalclose)*100)+50.

############ Welles Wilder RSI 3-day ##############

Define days3 5.

U3 is [close]-val([close],1).

D3 is val([close],1)-[close].

AvgU3 is ExpAvg(iff(U3>0,U3,0),days3).

AvgD3 is ExpAvg(iff(D3>=0,D3,0),days3).

RSI3 is 100-(100/(1+(AvgU3/AvgD3))).

############ Welles Wilder RSI 14-day ##############

Define days14 27.

U14 is [close]-val([close],1).

D14 is val([close],1)-[close].

AvgU14 is ExpAvg(iff(U14>0,U14,0),days14).

AvgD14 is ExpAvg(iff(D14>=0,D14,0),days14).

RSI14 is 100-(100/(1+(AvgU14/AvgD14))).

############Jay’s VixRSIRatio ##############

VixRSI3 is expavg(vixfix,3)/expavg(RSI3,3).

VixRSI14 is expavg(vixfix,3)/expavg(RSI14,3).

VixRSIRatio is -((((VixRSI3/VixRSI14)-1)*100)-50).

Jay Kaeppel

Disclaimer:  The data presented herein were obtained from various third-party sources.  While I believe the data to be reliable, no representation is made as to, and no responsibility, warranty or liability is accepted for the accuracy or completeness of such information.  The information, opinions and ideas expressed herein are for informational and educational purposes only and do not constitute and should not be construed as investment advice, an advertisement or offering of investment advisory services, or an offer to sell or a solicitation to buy any security.

Biotech + Gold (Updated)

In this article I wrote about an index I follow that combines the biotech sector with the gold stock sector. I also wrote about “one way” to trade that index.  This article builds on that piece and adds a new “rule” to create more trading opportunities.
The BIOGOLD Index
Figure 1 displays the index that I created using AIQ TradingExpert.  It combines ticker FBIOX (Fidelity Select Biotech) with ticker FSAGX (Fidelity Select Gold).
1
Figure 1 – Jay’s BIOGOLD Index (Courtesy AIQ TradingExpert)
Also included in the lower clip is an indicator referred to as RSI32, which is the 2-day average of the standard 3-day RSI.
The Old System
In the original article I tested an approach that works as follows using monthly data:
*When the RSI32 drops to 32 or below, buy BOTH FBIOX and FSAGX
*After a buy signal, sell both funds when RSI32 rises to 64 or higher
For results, please see the original article.
The New System
The “new rules” are as follows:
A “buy signal” occurs when either:
*The RSI32 drops to 32 or below
*The RSI32 drops below 50 (but not as low as 32) and then reverses to the upside for one month
After either of the buy signals above occurs, buy BOTH FBIOX and FSAGX
*After a buy signal, sell both funds when RSI32 rises to 64 or higher
Figure 2 displays the BIOGOLD Index with various buy and sell signals marked.
2
Figure 2 – Jay’s BIOGOLD Index with RSI32 signals (Courtesy AIQ TradingExpert)
To test results we will:
*Assume that after a buy signal both FBIOX and FSAGX are bought in equal amounts
*We will assume that both funds are held until RSI32 reaches 64 or higher (i.e., there is no stop-loss provision in this test)
For testing purposes we will not assume any interest earned while out of the market, in order to highlight only the performance during active buy signals. Figure 3 displays the hypothetical growth of $1,000 (using monthly total return data) using the “system”.
3
Figure 3 – Hypothetical Growth of $1,000 using Jay’s BIOGOLD System (1986-present)
Summary
For the record, I am not “recommending” that anyone go out and initiate trading biotech and gold based on what I have written here.  Before trading using any approach it is essential for a trader to do their own homework and carefully consider all of the pro’s and con’s associated with any specific approach.  For example, while the trade-by-trade results for the above look reasonably good, it should be noted that there have been 4 separate drawdown’s in excess of -19% along the way, including a maximum drawdown of -37% in 2008.  In considering any approach to trading it is essential to first think long and hard about how well one would “weather the storms”, BEFORE focusing on potential profitability.
To put it more succinctly is the simple phrase “Don’t cross the river if you can’t swim the tide.”
Jay Kaeppel
Disclaimer:  The data presented herein were obtained from various third-party sources.  While I believe the data to be reliable, no representation is made as to, and no responsibility, warranty or liability is accepted for the accuracy or completeness of such information.  The information, opinions and ideas expressed herein are for informational and educational purposes only and do not constitute and should not be construed as investment advice, an advertisement or offering of investment advisory services, or an offer to sell or a solicitation to buy any security.

The Biotech-Gold Stock Connection

At first blush there might not seem to be much to connect biotech stocks and gold stocks.
One type of company hires people to engage in high tech biomedical engineering in order to develop potentially life-saving – or at least, life altering – medical breakthroughs…
…while the other hires people to (essentially) dig holes in the ground and mine stuff (granted, valuable stuff, but stuff mined out of the ground nevertheless).
But there is one other connection – stocks of both categories are quite volatile. And that alone may be enough to create a potential opportunity.
The BioGold Index
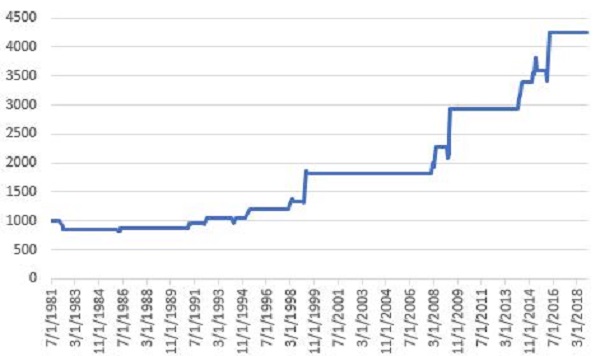
I created an “index” (such as it is) that combines Fidelity Select Biotech (FBIOX) and Fidelity Select Gold (FSAGX).  The index appears in Figure 1.  Like every other index in the world this index fluctuates up and down.
1Figure 1 – Jay’s BioGold Index (Courtesy AIQ TradingExpert)
The RSI32 Index
The RSI32 Index is simply a 2-day average of the standard 3-day RSI Index.  The code for AIQ TradingExpert EDS is below:
Define days3 5.
U3 is [close]-val([close],1).
D3 is val([close],1)-[close].
AvgU3 is ExpAvg(iff(U3>0,U3,0),days3).
AvgD3 is ExpAvg(iff(D3>=0,D3,0),days3).
RSI3 is 100-(100/(1+(AvgU3/AvgD3))).
RSI32 is simpleavg(RSI3,2).
The RSI32 Index for the BioGold Index appears on the monthly bar chart in Figure 2.
2aFigure 2 – The BioGold Index with RSI32 (drop to 33 or below = BUY) (Courtesy AIQ TradingExpert)
The BioGold “System”
The BioGold System works as follows:
*When the monthly RSI32 Index drops to 33 or lower, buy BOTH FBIOX and FSAGX
*After a “Buy Signal” then when the monthly RSI32 rises to 64 or higher, sell BOTH FBIOX and FSAGX
For testing purposes we will use monthly total return data for both FBIOX and FSAGX from the PEP Database from Callan Associates.
The Results
Figure 3 displays the results of the buy signals generated using the rules above (assumes that both FBIOX and FSAGX are bought after monthly RSI32 drops to 33 or lower and are held until monthly RSI32 rises to 64 or higher.
Buy Signal Sell Signal FBIOX+FSAGX % +(-)
4/30/1992 12/31/1992 +14.4%
2/26/1993 4/30/1993 +14.7%
4/29/1994 9/30/1994 +7.2%
12/30/1994 4/28/1995 +9.8%
4/30/1997 9/30/1997 +18.4%
11/28/1997 4/30/1998 +10.4%
6/30/1998 12/31/1998 +16.1%
3/30/2001 6/29/2001 +22.7%
7/31/2002 12/31/2002 +18.1%
7/30/2004 10/29/2004 +11.2%
3/31/2005 7/29/2005 +10.2%
4/30/2008 7/31/2008 +9.4%
9/30/2008 6/30/2009 +3.8%
5/31/2012 9/28/2012 +20.0%
2/28/2013 2/28/2014 +28.6%
8/31/2015 4/29/2016 +22.2%
12/30/2016 2/28/2017 +13.2%
Average % +14.7%
Median % +14.4%
Std. Deviation % 6.4%
Max % +(-) +28.6%
Min % +(-) +3.8%
Figure 3 – Trade-by-Trade Results
For the record, the “System” has been in FBIOX and FSAGX only 28% of the time (88 months) and out of the market 72% of the time (223 months).
Figure 4 displays the trades in recent years.
3
Figure 4 – BioGold System trades; 2012-2017 (Courtesy AIQ TradingExpert)
*The Good News is that all 17 signals since 1992 showed a profit, with an average gain if +14.7%.
*The Bad News is that, a) 17 trades in 25 years is a pretty small number of trades and, b) there are some not insignificant drawdowns along the way (-22.8% in 1998 and -22.4% in 2008, -14.1% in 2013 and -13.6% in 2016).
Still, for what it is worth the monthly equity curve appears in Figure 5.
4
Figure 5 – Growth of $1,000 invested using the “BioGold System”; 12/31/1991-12/29/2017
For the record, the “System” has been in FBIOX and FSAGX only 28% of the time (88 months) and out of the market 72% of the time (223 months).
For the record, the “System” has been in FBIOX and FSAGX only 28% of the time (88 months) and out of the market 72% of the time (223 months).  No interest is assumed to be earned while out of the market in the test above.
If we invest in short-term treasuries (1-3 yr.) while not in the stock market we get the results shown in Figure 6.
In Figure 6:
*The blue line represents the growth of $1,000 achieved by holding FBIOX and FSAGX when the BioGold System is on a “buy signal” and 1-3 yr. treasuries the rest of the time.
*The red line represents the growth of $1,000 achieved by buying and holding both FBIOX and FSAGX and then rebalancing at the end of each year.
The “System” grew to $19,863 and the “split” grew to $12,844.
5
Figure 6 – Growth of $1,000 using BioGold System plus 1-3 yr. treasuries when out of stocks (blue) versus buying and holding FBIOX and FSAGX and rebalancing each year (red);12/31/1991-12/29/2017
Summary
So is the “BioGold System” really a viable investment idea?  That’s not for me to say.  The per trade returns are pretty good but there aren’t a whole lot of trades and if history is a guide an investor would likely have to ride some significant drawdowns in order to reap the gains.
Still, market-beating performance is market-beating performance, so who knows?
Jay Kaeppel Chief Market Analyst at JayOnTheMarkets.com and AIQ TradingExpert Pro client.
Disclaimer:  The data presented herein were obtained from various third-party sources.  While I believe the data to be reliable, no representation is made as to, and no responsibility, warranty or liability is accepted for the accuracy or completeness of such information.  The information, opinions and ideas expressed herein are for informational and educational purposes only and do not constitute and should not be construed as investment advice, an advertisement or offering of investment advisory services, or an offer to sell or a solicitation to buy any security.

For Every Season, a Sector Fund Portfolio

In this article dated 1/28/16 I wrote about a simple two-fund portfolio that had somehow managed to make money from the end of January to the end of April, 27 years in a row.  OK, make that 28 years in a row.
The portfolio was 50% invested in retail stocks (via ticker FSRPX) and energy services stocks (via ticker FSESX).  As you can see in Table 1 below, FSRPX underperformed most of the major averages but FSESX far outperformed.  As a result, the 50/50 FSRPX/FSESX portfolio gained +12.8% from the end of January to the end of April.
1a
Figure 1 – Jay’s 2-Fund Portfolio versus Major Market Indexes
1
Figure 2 – Tickers FSESX and FSRPX; end of January through April (Courtesy AIQ TradingExpert)
This year’s gain (+12.8%) exceeded the historical average (+10.3%) and historical median (+10.1%).  So chalk one up for the good guys.
Moving on to May
In case you missed it, I also wrote recently about a “May portfolio” here. This portfolio is a bit more defensive in nature and consists of 25% in each of the four funds listed below:
FDFAX – Fidelity Select Consumer Staples
FSHCX – Fidelity Select Health Care Services
FSPHX – Fidelity Select Health Care
FGOVX – Fidelity Government Income Fund
This portfolio has showed a gain during the month of May in 22 of the past 27 years (or 81% of the time).
Jay Kaeppel
Chief Market Analyst at JayOnTheMarkets.com and AIQ TradingExpert Pro (http://www.aiq.com) client