There is great trepidation in the bond market these days. Most investors seem to have the “interest rates are sure to rise” mantra playing on auto loop in their head. And this is not entirely unwarranted. Given the historical tendency for bond yields to move in long, slow trends (20 years or more essentially in one direction is not uncommon), I for one am pretty confident in believing that interest rates will be higher 20 years from now than they are now.
But that is not the fear that is playing in people’s heads. The fear in people’s heads is that rates are rising soon (like immediately) and in a big way. This however, may or may not prove to be the case.
Figure 1 displays a history of 10-year treasury yields through about 2012 (FYI 10-yr. yields are roughly in changed since that time). Note the long-term nature of interest rate trends and that while there are “spikes” here and there, most major moves play out over time and not in “here today, sharply higher tomorrow” fashion.

Figure 1 –
Also, you can see in Figure 2 – one can make a compelling argument that bond yields are not “officially rising”, at least not yet.
Figure 2 – Yields still “officially” in a downtrend
Bonds are Due to Bounce – But Will They?
One way to identify important turning points in any market is when a market doesn’t do something that it would normally be expected to do. For example, here is a simple thought process:
1) The bond market is oversold
2) In the past 30 years, pretty much anytime it would get oversold a rally ensued
3) Therefore, bonds should rally soon
But will they – that is the question. And in my opinion, the answer is important.
*If bonds rally soon (i.e., over the course of say the next several months) then “the status may still be quo”.
*If bonds do not rally soon, then it may be a sign that “things are changing”
Which Way Bonds?
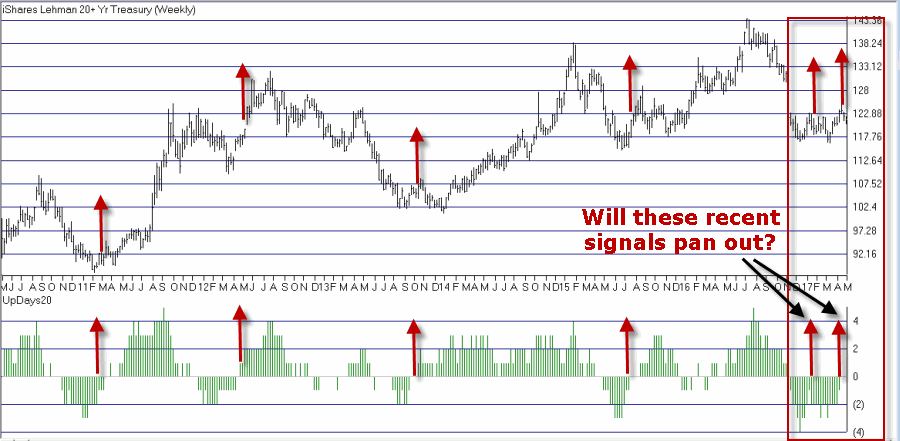
Figures 3 and 4 below display ticker TLT (an ETF that tracks the long-term treasury bond) with an indicator I call UpDays20. In this case we are looking at weekly bars and not daily bars, but the concept is the same.
UpDays20 is calculated by simply adding up all of the weeks that have showed a weekly gain over the past 20 weeks and then subtracting 10 (the AIQ TradingExpert Expert Design Studio code appears at the end of this article, after the disclaimer).
If 10 of the past 20 weeks have showed a weekly gain then the upDays20 indicator will read 0 (i.e., a total of 10 weeks were up minus 10 = 0). If only 6 weeks showed a gain in the past 20 weeks then the UpDays20 indicator will read -4, etc.
What to look for: Typically (at least in the declining rate environment of recent decades) when UpDays20 rises by a value of 2 from a low of -2 or less, a decent rally in bonds has ensued.
For example, if UpDays20 falls to -4 then a rise to -2 or higher triggers a buy signal. If it falls only as low as -3 then a rise to -1 or higher is required. If it falls only as low as -2 then a rise to 0 or higher is required.
Figures 3 and 4 highlight signals since roughly 2004.
Figure 3 – Ticker TLT with UpDays20 weekly buy signals (2004-2010); (Courtesy
AIQ TradingExpert)
Figure 4 – Ticker TLT with UpDays20 weekly buy signals (2010-2017); (Courtesy
AIQ TradingExpert)
As you can see in Figures 3 and 4, most of the signals highlighted were followed by at least a decent short-term rally.
In 2017, buy signals from the UpDays20 indicator occurred on 1/13 and 4/14. TLT is up +0.3% since the 1/13 signal and down -1.4% since the 4/14 signal.
Summary
Either:
1) This is an excellent time to buy the long-term bond (looking for at least a short to intermediate term rally) as a rally is overdue
OR
2) The “times they may be a changing” for bonds
So keep an eye on TLT over the next several months.
Jay Kaeppel
Disclaimer: The data presented herein were obtained from various third-party sources. While I believe the data to be reliable, no representation is made as to, and no responsibility, warranty or liability is accepted for the accuracy or completeness of such information. The information, opinions and ideas expressed herein are for informational and educational purposes only and do not constitute and should not be construed as investment advice, an advertisement or offering of investment advisory services, or an offer to sell or a solicitation to buy any security.
AIQ Expert Design Studio Code for UpDays20
Up1 if [close] > val([close],1).
Up2 if val([close],1) > val([close],2).
Up3 if val([close],2) > val([close],3).
Up4 if val([close],3) > val([close],4).
Up5 if val([close],4) > val([close],5).
Up6 if val([close],5) > val([close],6).
Up7 if val([close],6) > val([close],7).
Up8 if val([close],7) > val([close],8).
Up9 if val([close],8) > val([close],9).
Up10 if val([close],9) > val([close],10).
Up11 if val([close],10) > val([close],11).
Up12 if val([close],11) > val([close],12).
Up13 if val([close],12) > val([close],13).
Up14 if val([close],13) > val([close],14).
Up15 if val([close],14) > val([close],15).
Up16 if val([close],15) > val([close],16).
Up17 if val([close],16) > val([close],17).
Up18 if val([close],17) > val([close],18).
Up19 if val([close],18) > val([close],19).
Up20 if val([close],19) > val([close],20).
UpCount is (Up1+ Up2+Up3+Up4+Up5+Up6+Up7+Up8+Up9+Up10+Up11+Up12+Up13+Up14+Up15+Up16+Up17+Up18+Up19+Up20)-10.


