Buff Pelz Dormeier’s Volume Confirmation For A Trend System

In the August edition of Stocks and Commodities magazine, Buff Pelz Dormeier discusses Volume flows that help to validate trending and even non trending price movements. This study presents an updated trend-following trading system based on combining the ADX with the trend thrust indicator and volume price confirmation indicator.

The AIQ code for VPCI and related indicators is given below. This code can be used to develop trading systems, or the indicator can be used as a filter for existing systems. I tried different plotted indicator displays and decided that two smoothed VPCI indicators plotted as a histogram, which shows the difference between the two smoothed indicators, would give the most useful display.

The indicator plot shown below uses parameters of 50 and 10 days to compute the VPCI, then takes two simple averages of this VPCI using 5 days and 10 days. The difference between these two smoothed indictors is then plotted as a histogram.

!! CONNECITON & AFFINITY BETWEEN PRICE & VOLUME
! Author: Buff Dormeier, TASC July 2007
! Coded by: Richard Denning 5/11/07

! PARAMETERS
Price 	is [close].
LT	is 50.
ST	is 10.
S	is 5.
SS	is 10.

! SIMPLE MOVING AVERAGE OF PRICE (SMA)
SMA_L 	is sum(Price,LT) / LT.
SMA_S	is sum(Price,ST) / ST.
V	is [volume].

! VOLUME-WEIGHTED MOVING AVERAGE (VWMA)
VTOT_L 	is sum(V,LT).
VWMA_L	is sum(Price * (V / ^VTOT_L),LT).

VTOT_S	is sum(V,ST).
VWMA_S	 is sum(Price * (V / ^VTOT_S),ST).

! VOLUME-PRICE CONTRADICITION/CONFIRMATION (VPC + / - )
VPC	is VWMA_L - SMA_L.

! VOLUME PRICE RATIO (VPR)
VPR 	is  VWMA_S / SMA_S.

! VOLUME MULTIPLIER (VM)
VMA_S	is sum(V,ST) / ST.
VMA_L	is sum(V,LT) / LT.
VM	is VMA_S / VMA_L.

! VOLUME-PRICE CONFIRMATION INDICATOR (VPCI)
VPCI	is VPC * VPR * VM.

! SMOOTHED VOLUME-PRICE CONFIRMATION INDICATOR(sVPCI)
sVPCI	is sum(VPCI,S) / S.
ssVPCI	is sum(VPCI,SS) / SS.

! INDICATOR FOR HISTORIGRAM PLOTTING. 
dsVPCIss is sVPCI - ssVPCI.

Sample Chart

FIGURE 9: AIQ. SPY shown with 50-day VWMA (red), 10-day VWMA (yellow) and sVPCI, ssVPCI (50,10,5,10) historigram (lower indictor plot in white).

—Richard Denning
rdencpa@gmail.com
for AIQ Systems

Market Breadth Indicators What Works? 

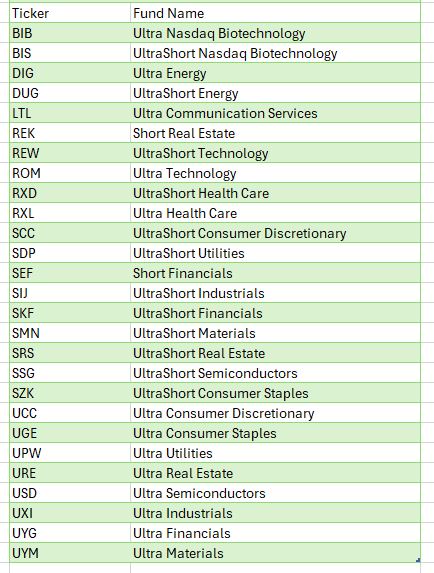
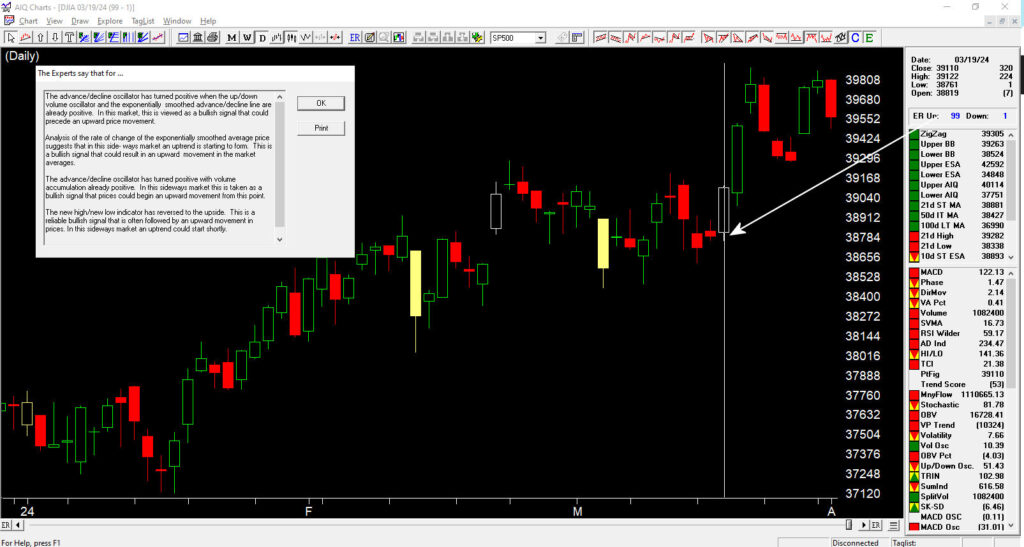
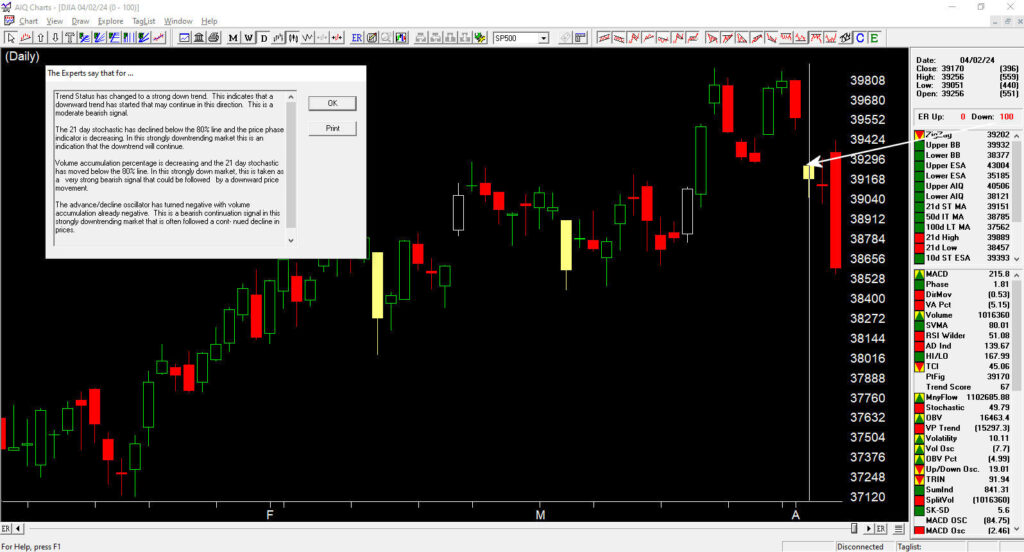
In this 45-minute session with Steve Hill, CEO of AIQ Systems, he evaluated the effectiveness of the major Market Breadth indicators and some unique ways to use breadth in AIQ. The AD Line, AD Indicator, AD Oscillator, TRIN and Up/Down Volume Oscillator were examined for effectiveness in signaling trend changes in the DJIA.

Steve also created the Arms Index, Zweig Breadth Thrust Indicator and Simple Advance/Decline indicator in EDS and added these to Charts

An EDS file with these indicators is included for you to download below. Download the EDS file here, save this file to/wintes32/ES strategies folder.

The PowerPoint presentation is also included. Download here

Combining Bollinger Bands with other Indicators 

In this 45-minute session with Steve Hill, CEO of AIQ Systems, Steve discusses how using Bollinger Bands and other indicators improves their effectiveness. Includes high volume on a breakout, Bollinger Bands in conjunction with longer-term moving averages, Riding the Bands, Bollinger Bands Squeeze, and adding candlestick engulfing patterns.

An EDS file is included for you to download below. This has the Candlestick Bullish and Bearish Engulfing patterns, occurring close to the relevant band. Download the EDS file here, save this file to/wintes32/ES strategies folder.

The PowerPoint presentation is also included. Download here

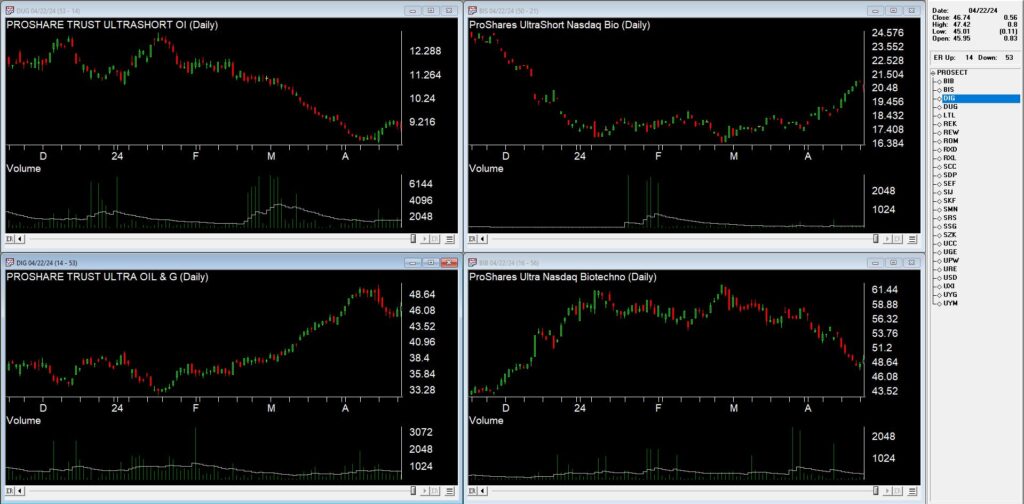
The 4 charts below show Engulfing Bullish pattern close to the Lower BBands on 7/3/24

Don’t Miss Out on Our Exclusive Annual Plan Savings!

AIQ TradingExpert Pro | World Leader in Intelligent Trading Software

“Best Artificial Intelligence Trading Software” Finalist 2024 and Semi-Finalist 2023, 2022 and 2021 Readers Choice Awards, Stocks & Commodities magazine

As the summer heat is in full swing, we’re excited to offer you a sizzling deal that’s too good to pass up! This time-sensitive offer is ending soon, so seize these incredible savings quickly!

🚀 Unlock the All-In-One AIQ Annual Plan Deal:

  • TradingExpert Pro Software: Access our award-winning software, giving you a comprehensive edge in your trading endeavors. Includes all upgrades for FREE.
  • Comprehensive Coverage: Comes with end-of-day data US & Canada Equities, US Mutual Funds, and Indexes.
  • Extensive Historical Data: Download end-of-day data with a rich 10+ years of historical information to backtest and refine your trading strategies.
  • AIQ Historical Dataset: Gain access to over 6500+ tickers refreshed quarterly, valued at $149.
  • Massive Savings: Save the equivalent of 2 months’ fees – that’s a whopping $200+ back in your pocket!

💰 Summer Sizzling Sale: Originally $1361

***** Now Just $998 ******

Yes, you read that right – over $300 in savings!

And if you’re looking for even more, we’ve got the Annual Plan with Intraday Snapshot at a steal. Originally $1577, it’s now just $1150!

Why Choose the Annual Plan?

Choosing the annual plan saves you money and ensures you have uninterrupted access to our top-tier trading tools and data throughout the year. Here’s why it’s the best decision you can make for your trading journey:

  • Significant Savings: Save over $300 instantly and over $200 annually by avoiding monthly fees.
  • Year-Round Access: Enjoy continuous access to all the features and updates without any interruptions.
  • Exclusive Content: Gain access to members-only webinars, workshops, and special reports.
  • Maximum Support: Receive maximum customer support to get your questions answered quickly.

PLUS here’s a link to our full features list so you’ll know what you’re getting with the AIQ TradingExpert Pro platform https://aiqeducation.com/

⏰ Hurry, This Offer Won’t Last Forever!

Our Summer Deal is your golden ticket to supercharge your trading and save big. This is a limited-time offer, and once it’s gone, it’s gone. Don’t let this opportunity slip through your fingers!

Ready to Save and Succeed?

Originally $1361, Now Just $998!

Join us now https://aiqeducation.com/annual-plans/

Join the community of successful traders who are already reaping the benefits of our annual plan. Make the smart move today and secure your spot before this offer ends!

Looking forward to seeing you take your trading to new heights!

Warm regards,

The AIQ Team

Act Fast! Don’t miss out on this chance to save big and enhance your trading game. Let’s make this summer one to remember with smart investments and great savings!

Combining Bollinger Bands with other Indicators

AIQ Zoom Workshop July 23, 2024 5 – 5:45 pm Eastern
Combining Bollinger Bands with other Indicators

Unlock the power of Bollinger Bands to enhance your trading strategy

What You’ll Learn:

– Key components and basic interpretation of Bollinger Bands
– Bollinger Bands combined with high volume on a breakout
– In conjunction with longer-term moving averages
– Riding the Bands
– Bollinger Bands Squeeze
– Adding candlestick engulfing patterns.

Reserve Your Seat https://us02web.zoom.us/meeting/register/tZMuc-yurTsjEtG7sn8Pwl91Jb0h71AoteKZ#/registration