January 7, 2021
Hello Everyone,
Happy New Year! As the new Year starts let us look at 2021 which was a good year for the stock market, especially the S&P 500 which gained 28% mostly because of the mega giant stocks like Apple, Microsoft, Google etc. The fast-growing disruptor stocks that did so well in 2020, rising hundreds of percent were down in 2021. There were many panic situations and moments during the year and many challenges, including the highest inflation in decades, Covid 19, and supply chain issues causing shortages. Prices for houses continued to soar and this all leads to the biggest concern being elevated Inflation. In addition, most of the asset prices, including stocks and other assets, especially many of the largest companies, real estate, and other assets are in bubble territory.
The biggest unknown is how long the current bout of inflation will last and how is the Federal Reserve going to deal with it. The Fed was very dovish on inflation over the last year, but over the last couple of weeks they have become much more hawkish. This is one of the reasons the stock market has gotten hit over the first few days of 2022. Therefore, the Treasury yields have risen a good deal in the first week of 2022. There are other concerns that will affect 2022 like the mid-term elections, earnings growth, covid, international threats from China and Russia. That said, with so many things going, the two major factors that cause stocks to rise over the long term are:
Earnings and interest rates.
If earnings rise 5 to 10% per year or more and interest rates stay relatively low, the stock market as a whole should rise. But if earnings slow or go negative and interest rates rise to a point where people put their money in fixed accounts then by the competitive nature of investments the market will fall. When you look at the stock market over the long term, it has been one of the best classes in which to invest rising about 9-10% per year. With earnings expected to rise 7% or more and interest rates expecting to rise 3 times in 2022, volatility should rise over the next few months. Currently, the large tech stocks are expensive right now. I like cyclical stocks like consumer discretion stocks, financials that do well as interest rates rise, small cap value, dividend stocks, floating rate bonds, and international stocks that do well as the dollar falls, and more in the value sector. Dividend stocks generally are a buffer to the downside of the market somewhat. In addition, there are many ways to reduce risk now in the market or to hedge. Bonds other than Inflation protected bonds or floating rate are a Sell.
Finally, we will always have walls of worries about the markets and investing, and that is what makes the market direction unpredictable and uncertain. That is why it is important that we should always look at your long-term plan and not on the day-to-day gyrations of the market. Volatility will always happen, year to year. The only thing we can guarantee that will happen in the market is uncertainty and volatility.
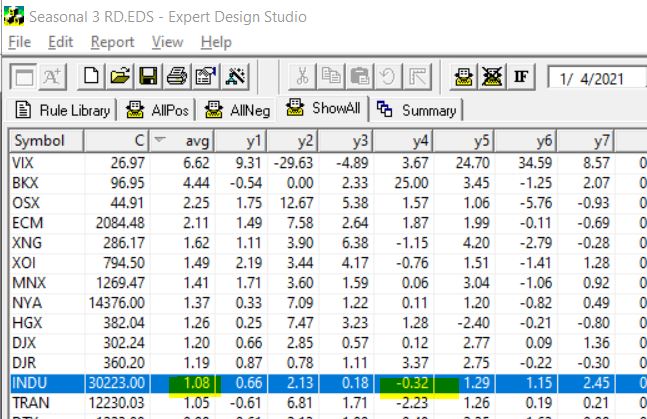
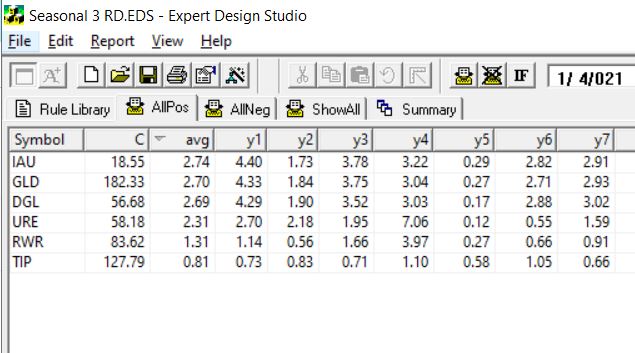
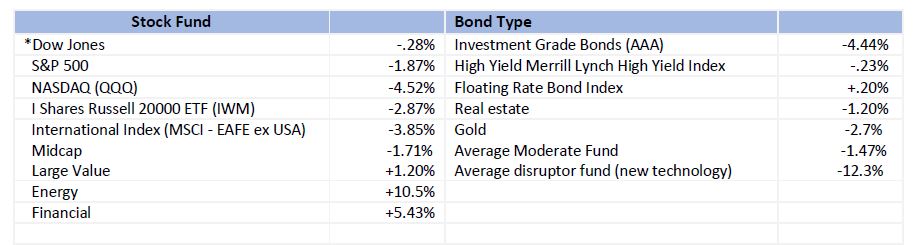
Some of the INDEXES of the markets both equities and interest rates are below. The source is Morningstar.com up until January 7, 2022
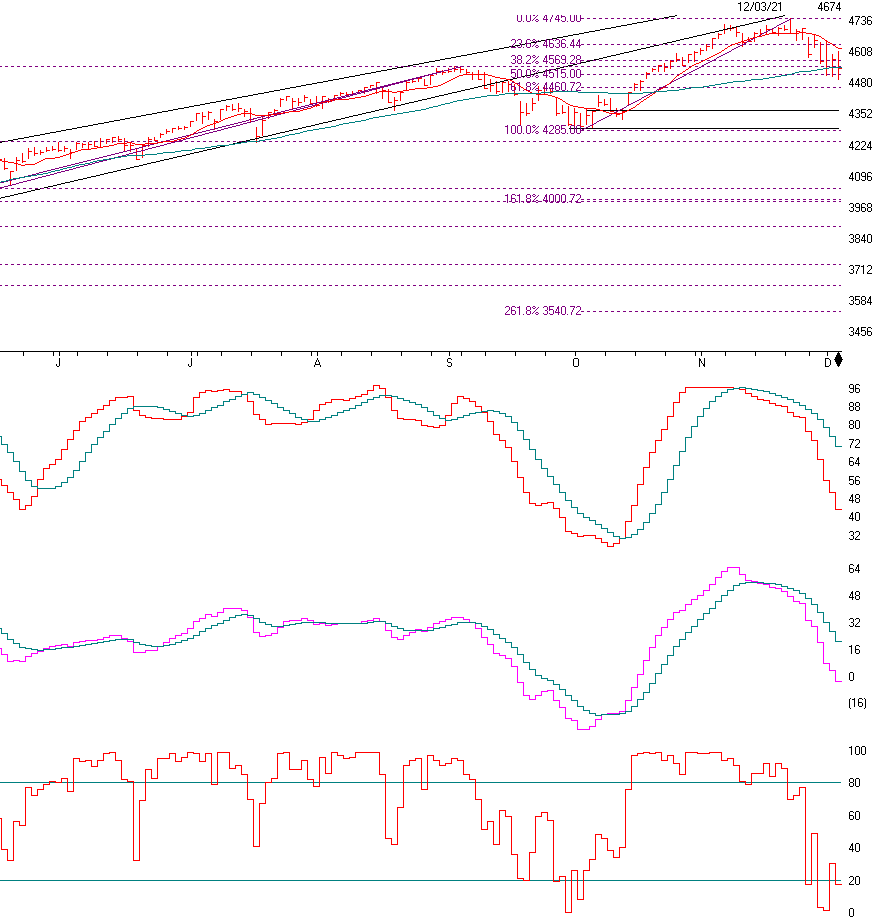
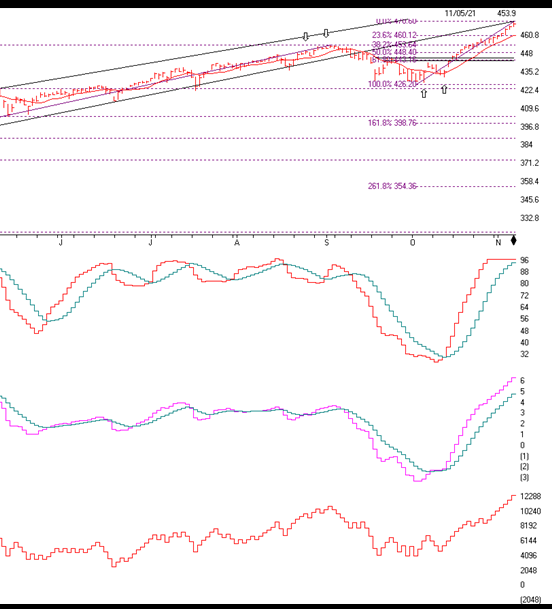
S&P 500
Support on the S&P 500 is 4660, 4540, 4361 and 4288.
Support on the Dow is 35969, 34885, 34072, and 33503.
Support on the NASDAQ is 15509, 14929, and 14415.
These are areas that the markets could turn and long term investors may want to add to their positions. They are areas not specific numbers.
BOTTOM LINE
The markets in the first week of 2022 have been volatile. The technology stocks are taking it on the chin while the value and dividend stocks are rising. I think the value, discretionary stocks as well as energy and financials look good currently and going forward into the year. Interest rates will go higher, With the Federal Reserve pumping money into the markets any large decline in the markets should be short lived. Covid pressures should be nearly over this year and earnings should go higher. But I do expect more volatility this year that could see the markets dropping 10% or more. By the end of the year, I expect the markets to be somewhat higher, but there are very tough earnings hurdles to overcome. Bonds are on the Sell block except floating rate bonds and Treasury Inflation protected bonds. If you haven’t spoken with me in the last 6 months, please call me. Now more than ever this is very important. Call me at 860-940-7020.
Joe Bartosiewicz, CFP®
Investment Advisor Representative
92 High Street
Thomaston, CT 06787
Securities and advisory services offered through SagePoint Financial, Inc. (SPF), member FINRA/SIPC. SPF is separately owned and other entities and/or marketing names, products or services referenced here are independent of SPF. 800-552-3319 20 East Thomas Road Ste 2000 Phoenix AZ 85012
Disclaimer: The views expressed are not necessarily the view of Sage Point Financial, Inc. and should not be interpreted directly or indirectly as an offer to buy or sell any securities mentioned herein. Securities and Advisory services offered through Sage Point Financial Inc., Member FINRA/SIPC, an SEC-registered investment advisor.
Past performance cannot guarantee future results. Investing involves risk, including the potential loss of principal. No investment strategy can guarantee a profit or protect against loss in periods of declining values. Please note that individual situations can vary. Therefore, the information presented in this letter should only be relied upon when coordinated with individual professional advice. *There is no guarantee that a diversified portfolio will outperform a non-diversified portfolio in any given market environment. No investment strategy, such as asset allocation, can guarantee a profit or protect against loss in periods of declining values.
It is our goal to help investors by identifying changing market conditions. However, investors should be aware that no investment advisor can accurately predict all of the changes that may occur in the market.