This time of year you might expect us to be thinking about the Santa Claus rally, but after the beating we’ve had the last few days, lets check and see how effective this really is.
What Is a Santa Claus Rally?
I lifted this description from Investopedia
A Santa Claus rally describes a sustained increase in the stock market that occurs in the last week of December through the first two trading days in January. There are numerous explanations for the causes of a Santa Claus rally including tax considerations, a general feeling of optimism and happiness on Wall Street, and the investing of holiday bonuses. Another theory is that some very large institutional investors, a number of which are more sophisticated and pessimistic, tend to go on vacation at this time, leaving the market to retail investors, who tend to be more bullish.
To test this in Expert Design Studio, I used the Seasonality3 ED built-in strategy. I set the Season Length days to 7 days to encompass the last 5 trading days of December and the first 2 days in the New Year.
By setting the date to 1/4/21, the rule looks back 7 trading days from January 4th, each of the last 7 years and gives us an approximate percentage return for each of those 7 days.
Some years with weekends and extra holiday days plus 252 is used as default trading days skew results a small amount. To compensate I also tested 10 trading days back from January 7. The results from the 7 days are below, I tested all the indices in my current database.
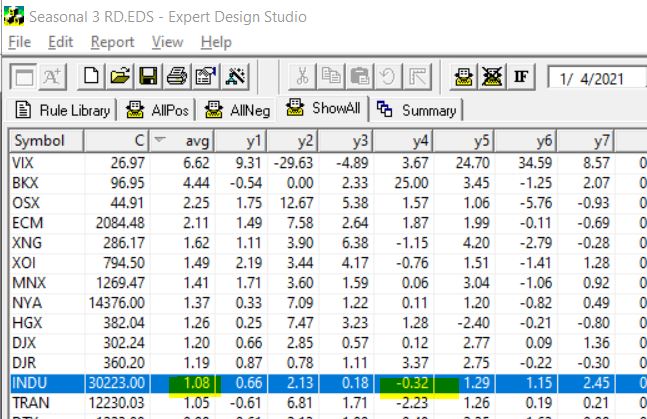
INDU is highlighted, this is the Dow 30 index. First it’s clear that in every year except for one, over the last 7 years the Dow has made gains in the Santa Claus period. The average gain Is over 1%. Not too bad for a 7 day trading period. BTW the results from the 10 days from January 7 were similar.
The NASDAQ on the contrary had 3 losing years out of the 7.
So next I decided to look at what ETFs are most likely to have a Santa Claus rally. Here’s the results using the 7 trading days back from Jan 4. This is the ETFs that had gains every year for the last 7.
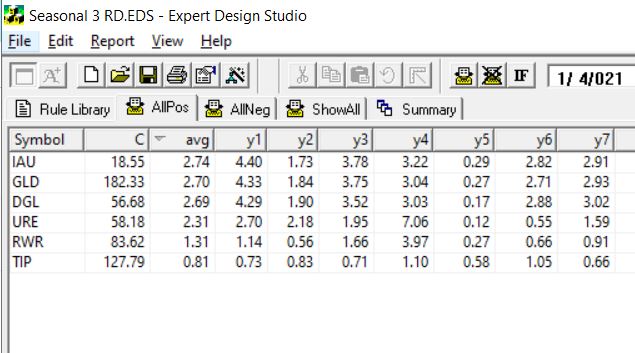
The first 3 ETFS are all Gold related, the next two are real estate/REITs the last one is a bond fund. Hmm something to keep in mind.
Here’s GLD seasonal charts the right hand side of each year shows the Santa Claus rally clearly. The White line is the average of all 7 years.
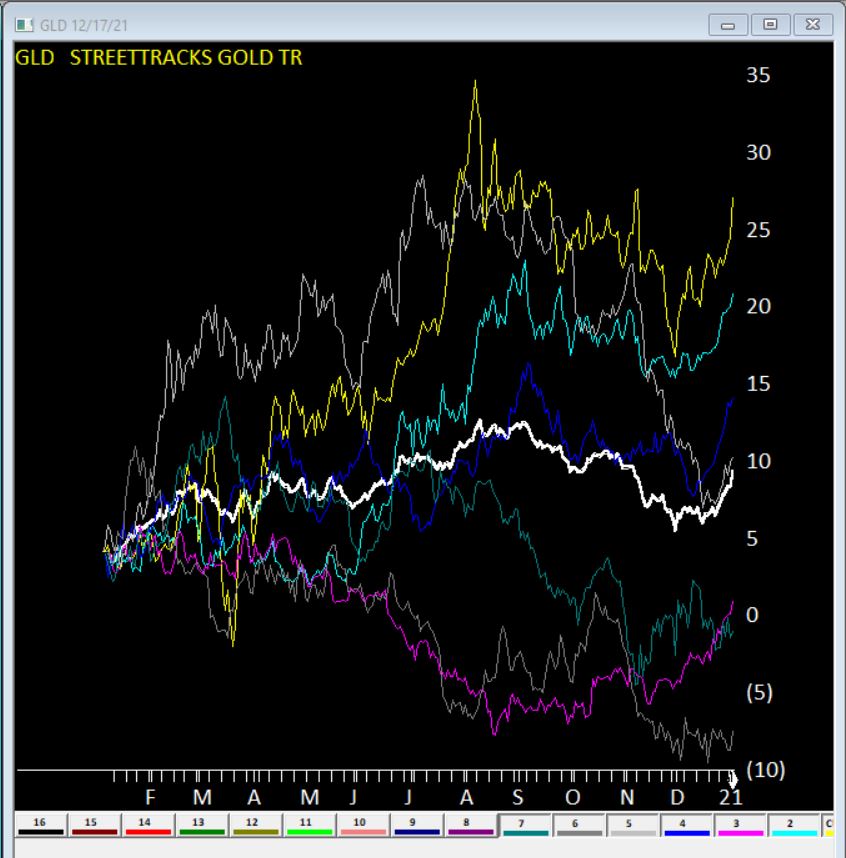
Clearly no guarantees what will happen this year, but something to keep in mind.