Dear Traders
Happy Holidays or not given how the Markets tumbled the day after Thanksgiving. BTW, it was also the last full week of November.
Time for me to run my AIQ seasonal filter on my top 2500 stocks
The filter is highly configurable and I can select which period of time, looking back from a given date to find a consistent price move up or down. I’m looking for it to repeat every year going back 7 + years.
I first came across the concept of seasonal consistency through Jay Keppel’s work JayOnTheMarkets.com and his books on Seasonal Stock Market trends. Many of you will have heard of the classic seasonal patterns like ‘Go Away in May’ or “the Santa Claus rally’. My AIQ seasonal screener can find these type of events in individual stocks. Events that happen every year at the same time.
Here’s how the AIQ Seasonal Screener works
How long do you usually hold a trade? I like to hold a trade for a month or less, that’s about 22 trading days.. So, I have cash available to invest Monday November 29th. All I need do is pick a date one month from that date and look for stocks that consistently made a profit over those 22 trading days, long or short, every single year going back the last 7 years. You can look back further but 7 seems to be pretty good consistency to me.
It’s that Simple
November 29th to December 29th, there were a handful of long stocks with seasonal patterns and the same on the short side. I liked the short side given the current market.
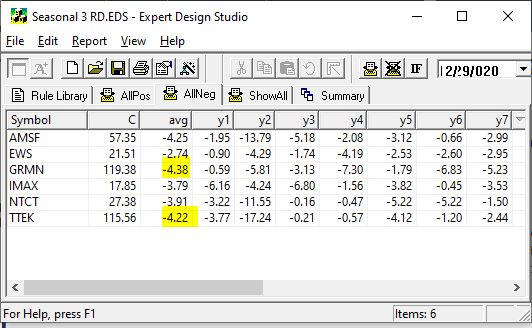
All these stocks lost money in every December for the last 7 years
I highlighted GRMN and TTEK as both on average lost over 4% in December for last 7 years.
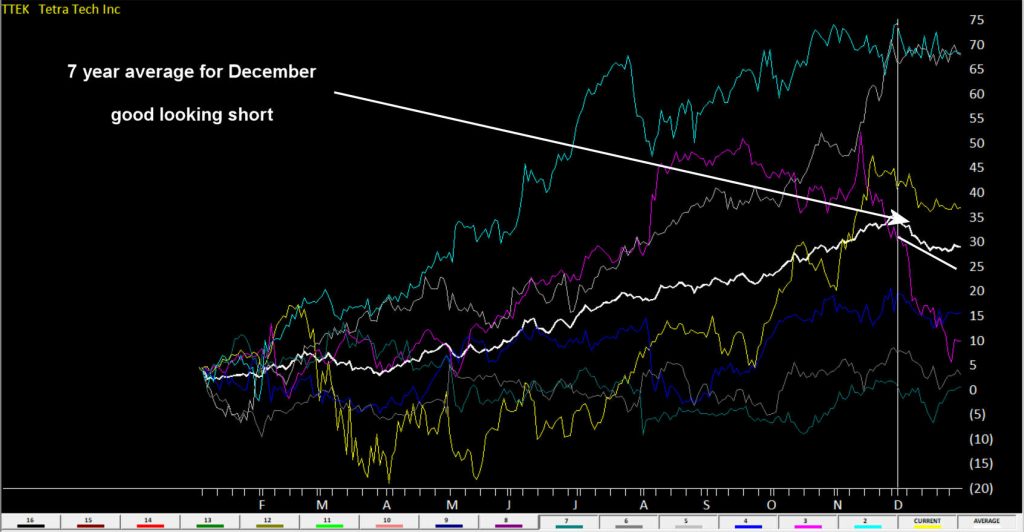
Here’s an AIQ 7 year seasonal chart of TTEK the white line is the average
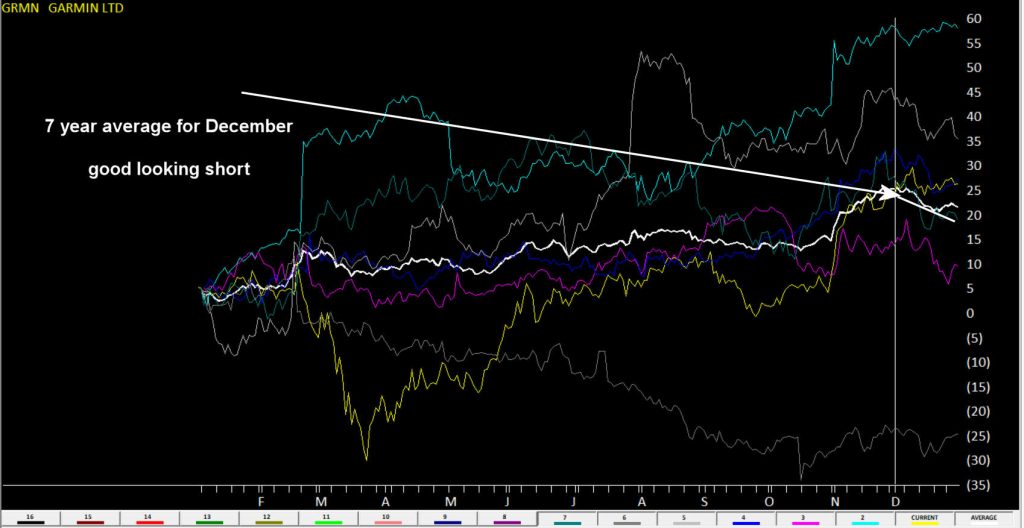
Here’s an AIQ 7 year seasonal chart of GRMN the white line is the average
Want to go long?
While there were no candidates in my US stocks, there were 3 UK stocks showed up. BRW-LON averaged 9.61% in December over 7 years. That’s impressive.
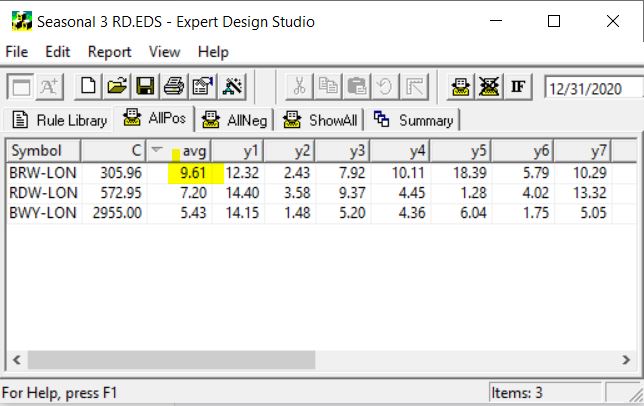
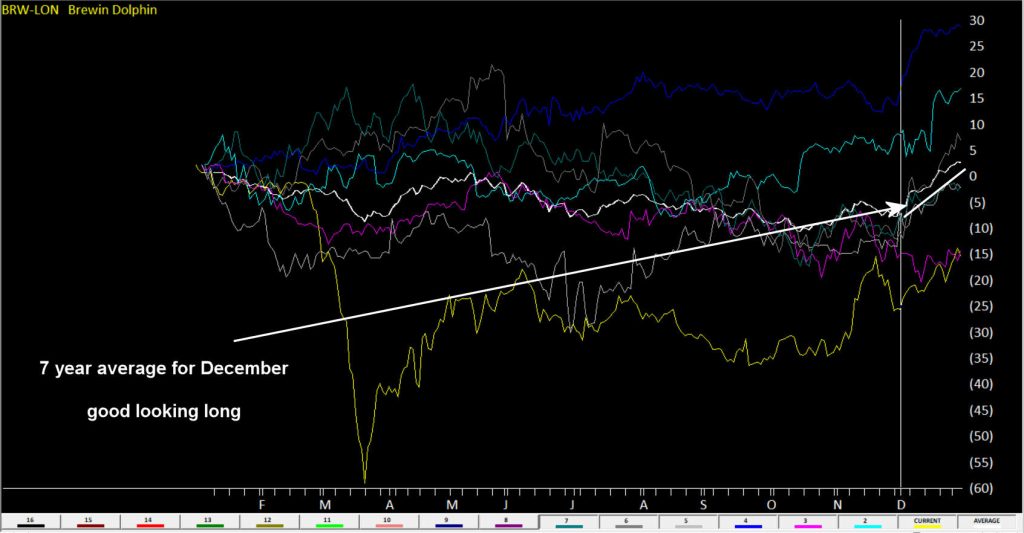
Here’s an AIQ 7 year seasonal chart of BRW-LON the white line is the average
Next time I’m going to start to look at the major markets in specific periods and see if we can identify seasonal patterns that are hidden under the radar of everyday noise.
How can I run an AIQ Seasonal scan?
- First download the scan from our server click here
- Locate the file Seasonal 3 RD.EDS likely in your /download folder and move it to your /wintes32/EDS Strategies folder
- Open AIQ EDS from the Main Menu
- Click File, Open and locate the /wintes32/EDS Strategies/Seasonal 3 RD.EDS file
- The file is set for seasonal length of 22 days but you can change this to whatever length you wish
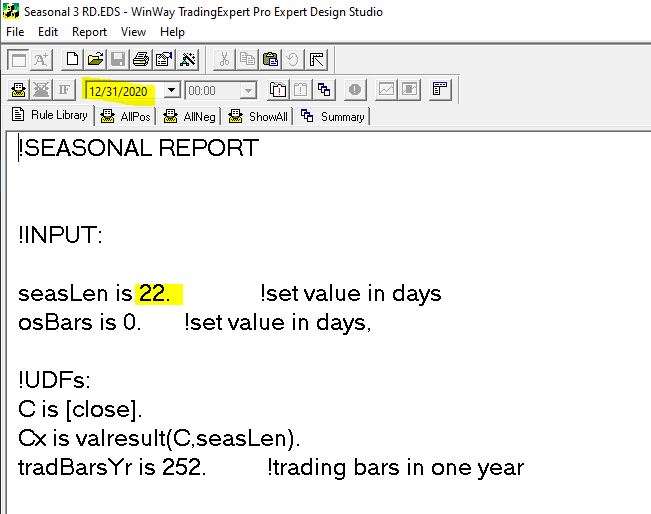
- Remember the date you run the report, like in the example above is 12/31/2020, it looks back in this case 22 days, then it checks 12/31/2019 and looks back 22 days etc. There would be no point it setting the date to run the report to the current date as it would look back 22 days, and you’d have missed the seasonal candidate stocks move.
Try TradingExpert Pro with end of day data for $1

All the powerful features of AIQ TradingExpert Pro end of day are included
- AI-based Signals Uncover Hidden Trades
- Time Saving Analysis with Chart Barometer
- Every Chart your way with Custom Layouts
- Time Saving Power! 200 Screening Reports
- Build a Trading System or select from 100s canned idea
- Complete Array of Analysis Tools
- Professional Level Portfolio Management
- Matchmaking Correlation tools
- Automate Your Winning Systems with Portfolio Simulation Tools