November 7, 2021
Hello Everyone,
Wow, it was a good month for the stock market. Last month if you read the Bartometer I stated that my computer technical analysis models were giving me BUY signals and that it was a good time to add to equities after I was saying on my August and September Bartometer that the market should fall.
Well, the market went up 6-9% since those signals and your stock side of your asset allocation total should have risen nicely. On the other hand, the bond side actually fell slightly. Where do we go now? Well, the stock market is now 33% overvalued based on earnings and interest rates, but we have tail wind seasonal strength that could push the market higher into the end of the year. Even though the market could continue rising, I don’t see it rising more than 3-5% from here.
The risk is now getting a little high. If your stock allocation is high and you are near or in retirement I would reduce equities somewhat. There are also buffered ETFs (Exchange Traded Funds), that will allow growth on the upside and protection on the downside.
The economy still is doing relatively well and earnings should continue to grow 10+ plus for next year. Where do I think the best sector will be over the next 5 to 10 years? Artificial Intelligence! Right now the entire artificial intelligence market is under $80 billion per year and over the next 10 years many analysts are predicting it could be an $80 Trillion market. This sector could grow more than 42% per year over the next 10 years. There are ETFs and stocks that should benefit from this trend. Other than that I love large cap growth mixed in with small cap value.
Inflation and interest rates are expected to rise over the next year. Bond investments should be kept to a short duration and floating rate bonds that will raise the interest rates should be popular. In addition, financial stocks tend to do better in a rising interest rate environment.
Listed below are some of the INDEXES for both the equities and interest rate markets.
Dow Jones +20%
S&P 500 +26.1%
EQUAL WEIGHTED S&P 500 +27.3%
NASDAQ Aggressive growth +27.1%
Large Cap Value +20.0%
I Shares Russell 2000 ETF (IWM) Small cap +35.2%
Midcap stock funds +27%
International Index (MSCI – EAFE ex USA +9.02%
International Emerging Markets -1.22%
Financial stocks +37.5%
Energy stocks +58%
Healthcare Stocks +18%
Investment Grade Bonds (AAA) Long duration -1.4% High Yield Merrill Lynch High Yield Index +3.63%
Floating Rate Bond Funds +4.02%
Short Term Bond +.67% Multi sector bond funds +2.7%
Gold -4.68%
10 year Bond Yield 1.45%
Moderate Fund +12.4%
Average Disruptor Fund Aggressive growth -1.8%
Dr. Robert Genetski’s Excerpts
Market Outlook
Another week, another series of new highs for stock prices. All the key indexes surged higher this past week. Small cap ETFs led with gains of 4%, the NASDAQ rose 3%, the S&P500 2%, the Dow up 1%.
Once again there was a flurry of good news on the economy, financial front and policy front. For the economy, business surveys from early October indicated healthy growth. Financial markets improved as interest rates declined in the wake of the Fed’s taper announcement.
On the policy front, the election of Republicans to state office in Virginia, a close election in New Jersey and city elections to restore law and order were a clear rejection of woke policies. Look for Democrats to scale back their destructive policy plans or face total defeat in next year’s elections.
For stocks, the latest surge brings the S&P500 to 33% above its fundamental value. The combination of low interest rates and the Fed’s promise to keep them low until at least the middle of next year, point to the potential for additional increases in stocks. However, the higher they go, the greater the risk an abrupt surge in interest rates will lead send them tumbling down.
A Look Back
Today’s employment report shows a strong gain of 604,000 private payroll jobs in October. Moreover, gains in hours worked and in average hourly earnings both increased at annual rates of 4% to 5%.
The employment data are consistent with other reports, all of which show real growth in the economy is increasing at close to a 5% annual rate going into the final months of this year.
S & P 500
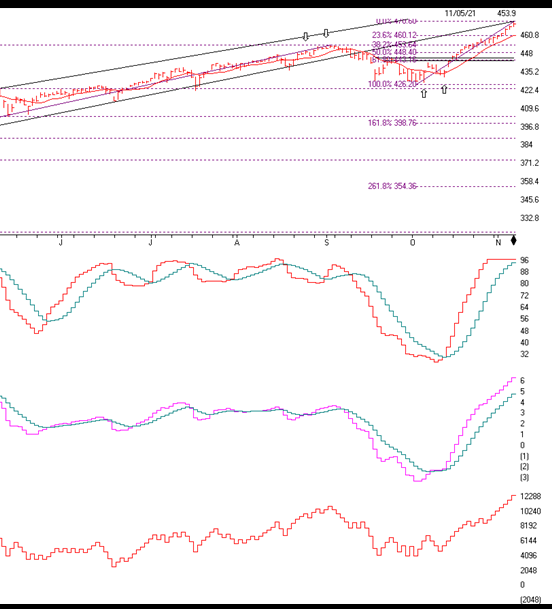
The S&P 500 is above. As you can see, the up arrow indicator is where my computer models showed a buy signal on October 10th and the subsequent rally. I am still long term BULLISH on the market, but we are again getting somewhat overbought and the market is 33% overvalued so you need to be a little careful. Any agitation in the economy or political arena could make the market fall.
There is also one thing I want to show you. See where the arrow is putting? That is the extended trend-line where it supported the entire rally over the last year. That trend-line is now at resistance unless it is broken on the upside and the market stays above that line for 2 to 3 days.
So we need to watch either the break on the upside or the topping of the market right where the arrow is pointing. Seasonally the market forces are still to the upside.
next on the chart is the SK-SD Stochastics chart, this shows the level at which the markets are oversold or overbought. Last month it was under 32,
(oversold), now it is overbought (over 88). This means over the 88 level the markets are more overbought compared to when the SK-SD Stochastics was below 32 when it was oversold and more attractive.
The MACD (or Moving Average Convergence Divergence graph) is next. I call it the momentum indicator. Last month, the pink line was about to break out above the aqua line and I said it was oversold and a BUY. Now it has rallied and it’s no longer cheap.
On balance is to the left and it is a powerful indicator. You want to see the indicator breaking out to new highs when the market is and as you can see, the indicator is breaking out to new highs as the market is as well. This is positive. I wish volume were stronger as the market is pushing to highs. This is good, but would like to see it stronger for conviction.
Support levels on the S&P 500 area are 4601, 4563, and 4484 Slight Resistance at 4706
NASDAQ support levels are 15,540, 15400, 15,278 and 14,857
These may be safer areas to get into the equity on support levels slowly on the accumulation areas.
THE BOTTOM LINE:
The markets rallied nicely over the last month and as indicated on the Bartometer we got Buy signals on October 8th and we are in seasonal strength. Even though the seasonal indicators are still positive, technical indicators are now getting a little overbought. This means not to add a lot to the markets like I indicated last month. I like large cap growth as well as small value and financials. Artificial intelligence should be one of the fastest growing sectors over the next 10 years.
Best to all of you,
Joe Bartosiewicz, CFP®
Investment Advisor Representative
Securities and advisory services offered through Sagepoint Financial, Inc. (SPF), member FINRA/SIPC. SPF is separately owned and other entities and/or marketing names, products or services referenced here are
independent of SPF. 800-552-3319 20 East Thomas Road Ste 2000 Phoenix AZ 85012
Technical Analysis is based on a study of historical price movements and past trend patterns. There is no assurance that these market changes or trends can or will be duplicated shortly. It logically follows that historical precedent does not guarantee future results. Conclusions expressed in the Technical Analysis section are personal opinions: and may not be
construed as recommendations to buy or sell anything.
Disclaimer: The views expressed are not necessarily the view of Sage Point Financial, Inc. and should not be interpreted directly or indirectly as an offer to buy or sell any securities mentioned herein. Securities and Advisory services offered through Sage Point Financial Inc., Member FINRA/SIPC, an SEC-registered investment advisor.
Past performance cannot guarantee future results. Investing involves risk, including the potential loss of principal. No investment strategy can guarantee a profit or protect against loss in periods of declining values. Please note that individual situations can vary. Therefore, the information presented in this letter should only be relied upon when coordinated
with individual professional advice. *There is no guarantee that a diversified portfolio will outperform a non-diversified portfolio in any given market environment. No investment strategy, such as asset allocation, can guarantee a profit or protect against loss in periods of declining values. It is our goal to help investors by identifying changing market conditions. However, investors should be aware that no investment advisor can accurately predict all of the changes that may occur in the market.