ASAP is an abbreviation for Affluence Squared Automation Project™.
I found in my research that the probability of correctly predicting a stock price movement increases as one extends one’s time horizon, so I decided early on that I wasn’t interested in day trading. What I was looking for was not just stocks that would go up, but stocks that would go way up and stay up. Hence “Affluence Squared”.
What exactly is ASAP?
It is well established that changes in earnings drives stock prices in the direction of the change. Thus if one could ascertain future ramps or declines in earnings, or more generally a coming change in a company’s financial condition, one would have a leg up. To assist a trader in this effort, I created a trading strategy using AIQ TradingExpert Pro.
Specifically, ASAP is a computer-based data collection, analysis and reporting algorithm designed to assist a knowledgeable and qualified investor in uncovering future organizational conditions with precision and understanding which are optimal in quality and timing. ASAP includes both long and short strategies which have been backtested through bull and bear markets.
How does ASAP help the user make stock selections?
It is well-established that the markets are discounting mechanisms. Some traders rely exclusively on technicals, some exclusively on fundamentals, and others some combination of the two. But all these have pitfalls.
Proper entry and exit points can often be mistimed with too heavy a reliance on backward-looking fundamental data. Indeed, retail investors are always mostly wrong at tops and bottoms.
Chart patterns and analysis of price and volume and pivot points can often clue an investor that a company’s condition has turned or remains favorable, often before the fundamentals even show it. Some very basic price and volume rules can do a decent job of picking up breakouts. However, the same exact technical parameters can work in one company’s case and fail in another, or can work for the same company at one time and fail at another.
Therefore, a fundamental data statistic that is “forward looking” would be useful as a differentiator. There does happen to be a legal, broadly available, readily quantifiable, and forward-looking fundamental statistic proven to beat the market indexes – insider buy/sell transactions. This forward-looking data is definable and comparable statistically, automatable over a universe of stocks, and is integrated with our technical strategy. Insider transactions, filtered by a special set of rules designed to maximize their predictive value, elegantly meet the requirements for a successful fundamental differentiator.
ASAP reports and displays on a price chart the actual insider transactions, but more importantly, provides and uses an insider score estimating probabilistic performance relative to the market based on statistical analysis of past similar transactions.
ASAP mostly ignores past fundamental information, except for information that statistically enhances the insider transactions, such as seasonality, market cap, and earnings surprises.
Further, insider information is aggregated for display and strategy use, providing a series of concentrically expanding macroeconomic forward-looking fundamental information.
ASAP includes both long and short strategies which have been backtested through bull and bear markets. Comparisons wherein the only change was the use of insider scores to further differentiate technical entry and exit points show a material improvement in backtest performance.
Who created ASAP and what is their background?
Here’s my brief bio. Mr. Dan Kamhis developed the ASAP mathematical models, proprietary indicators and strategy algorithms. He received a bachelor’s in mathematics from the University of California, San Diego, Magna Cum Laude in 1978. He has over 30 years of software development experience in aerospace simulation and real-time graphics, systems software for Windows and Unix platforms, and over 10 years’ experience in integrated stock strategy and indicator development. He is a patented inventor and published author.
Mr. Kamhis was assisted by Mr. Joe Osgood who programmed an assortment of data collection and database routines. Mr. Osgood received a B. S. in Computer Science from Worcester Polytechnic University in 1973. He has over 30 years of software development experience and is currently a senior software engineer at a rapidly growing medical device company. He is a published author.
Who can benefit from ASAP?
ASAP models real-world phenomena, is empirically tested, and is based on rigorous statistical analysis. Thus, the ASAP solution is scalable, providing tools to assist an investor trading a personal account, or the manager of a large institutional fund.
Can you give actual ASAP backtest results?

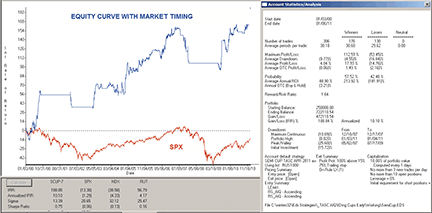
Chart 1 shows a six-year backtest covering two bull markets, and a bear.
The stock sample included approximately 5500 stocks which had insider transactions.
A key point is that the strategy is fully invested during the bull market, exits and remains out for the duration of the secular bear, and then leverages back in at the start of the bull, then exits for the correction.

The round-trip transactions over the six-year period, average three every two weeks (Number of trades: 465).
While the ratio of winners to losers is only 54% / 46% (Probability), the average gain for the winners is 66%, while the average loss is 16% (Average Profit/Loss), leading to a Reward/Risk ratio of over 5.
The annualized ROI (Average Annual ROI) is an astounding 75% a year, due to the fact that the strategy exits the market during bear phases.
Is ASAP versatile enough to allow the user to create new indicators or stock analysis procedures?
With a source license, one could obtain the strategy itself which gives further flexibility in creating and modifying the ASAP indicators and procedures. And certainly the ASAP developers would be interested in hearing from anyone with any ideas for improvements in the strategy, or if someone was interested in a proprietary custom modification.
How is ASAP different from other programs on the market?
ASAP is not a repetitive day trading or churn strategy, but is designed to leverage in and out of the market based on the market and stock stage.
The ASAP strategy takes into account the affinities in the market between individual stocks, and their groups and sectors and the market indexes themselves.
ASAP reports and displays the actual insider transactions on a price chart, but more importantly, computes, displays and uses an insider score estimating probabilistic performance relative to the market based on statistical analysis of past similar transactions.
ASAP provides customizable daily and weekly reports indicating stocks which have surpassed their technical pivot points (breakouts or breakdowns) and have qualified insider scores. While ASAP attempts to capture the earliest breakouts in a long-term uptrend, continuation signals are provided for focus on a particular ticker.
A general “Breakout Rank” score is provided ranking all stocks relative to their combined technical and insider score.
Stocks can also be ranked strictly by insider criteria, such as a weighting consisting of insider score and a measure of recent changes to the insider transaction patterns.
ASAP provides a range of selectable stops designed to minimize whipsaws, including investing, trading and climax stops.
Is there an ASAP community?
What are the computer and operating system requirements for ASAP?
Even five-year-old computers can run it pretty well, but ASAP is customizable in this sense. Some indicators are more compute intensive than others. On an older or slower machine, one can limit the use of the more compute intensive indicators to only when the trader is specifically interested in them.
If someone is interested in finding out more about ASAP, what should they do?
They can drop me (Dan Kamhis) a line at trade.asap@yahoo.com, and I’ll be glad to set up a web demo.
Thank you for spending time with us Dan.